
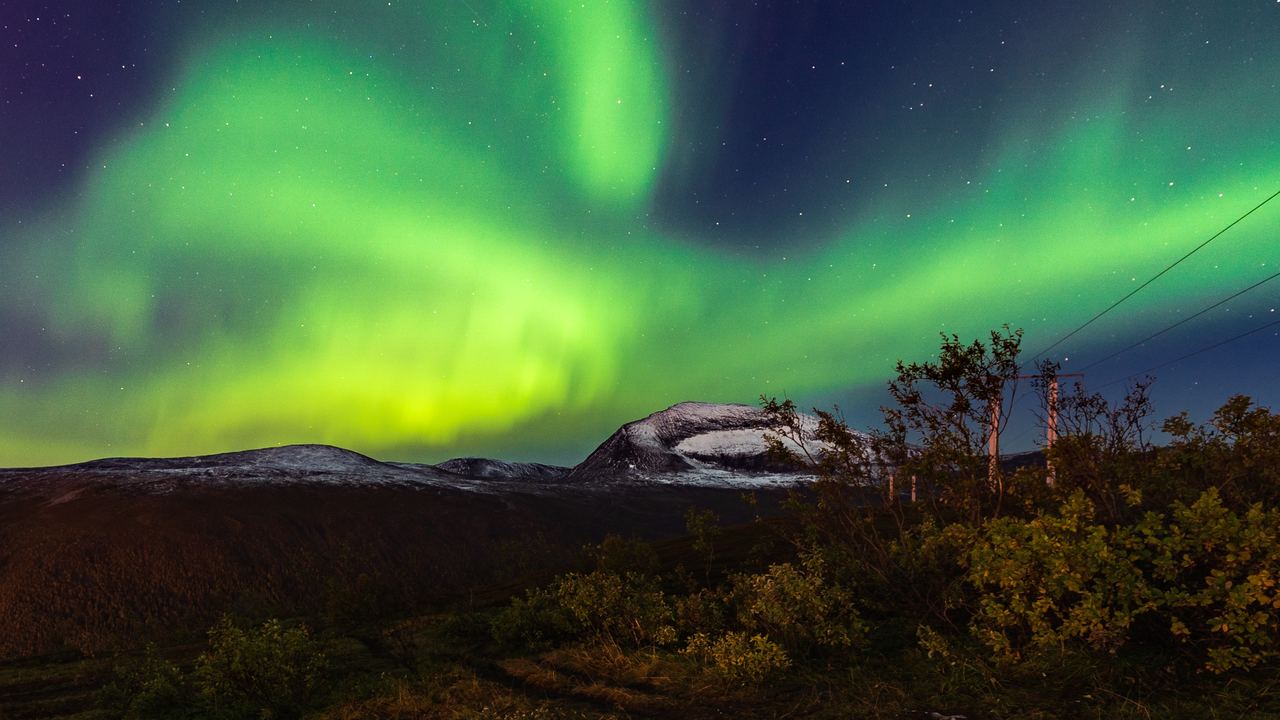
Kp is the number everyone quotes and almost nobody explains. It gets treated as an aurora meter, as though 5 means a good night and 2 means stay in. It is not that, and using it that way will cost you nights.
Here is what it is, where it comes from, and the three properties that make it much less useful for planning an evening than its popularity suggests.
Where the number comes from
Julius Bartels introduced the local K index in 1938 at the Niemegk observatory near Potsdam, and the planetary version, Kp, in 1949. It has been calculated the same way ever since, which is a large part of its value: it is one of the longest consistent records in geophysics.
The method is to measure how much the horizontal component of the magnetic field wobbles at a set of observatories, compared with what a quiet day looks like at each of them, over a three-hour window. Those local values get standardised and combined into one planetary figure from thirteen observatories.
Kp runs from 0 to 9, in thirds. So the real scale is 0, 0+, 1-, 1, 1+, and so on, which is why you sometimes see values like 4- quoted. It is a measure of how disturbed earth's magnetic field has been, used as a proxy for how much energy the solar wind has been putting in.
Three things that limit it
| Property | What it means for your evening |
|---|---|
| It is planetary | One number for the whole earth. It says nothing about whether the oval has brightened over your particular longitude |
| It is retrospective | The window has to close before the value exists. A three-hour figure describes what already happened, not what is about to |
| The observatories are outside the aurora zone | All thirteen sit away from the auroral zone by design, so the index stays comparable. It is inferring activity, not observing your sky |
| It is quantised in thirds | The difference between 3 and 3+ is small and the difference between 2 and 5 is enormous, but both look like one step in a list |
| It knows nothing about cloud | The largest single factor in whether you see anything is entirely absent from the number |
The sentence that matters
A clear sky at Kp 2 beats a cloudy sky at Kp 6. Every time, without exception, because you cannot see through cloud.
This sounds obvious written down and yet the whole retail apparatus around the aurora is built the other way round. People refresh Kp apps, book on the strength of a forecast number, and stand under solid overcast. Our cloud statistics exist because that is the variable you can actually plan for, months ahead, and Kp is not.
There is a second reason not to fixate on Kp if you are going somewhere like Tromso. Sitting inside the auroral oval means the display can be overhead at Kp 1 or 2. High Kp values matter enormously if you are trying to see the aurora from Scotland or Germany, because they mean the oval has expanded far enough south to reach you. From inside the oval, a big number mostly means the show has moved to somewhere further south than you are.
What to look at instead
If you want to actually use forecasts on the night, in rough order of usefulness:
- The cloud forecast. Genuinely the most important input, and the one your guide will be using to decide where to drive.
- Bz, the north-south orientation of the interplanetary magnetic field measured upstream. When it is pointing south, the field can connect with earth's and energy starts loading. This is a live measurement with roughly 15 to 60 minutes of lead time, and it is a far better short-term signal than Kp.
- Solar wind speed and density, from the same satellites. Faster and denser is better.
- The oval maps, which show where the ring is sitting right now rather than reducing everything to one integer.
- Kp, as a general indication of whether the last few hours have been active. Useful context, poor trigger.
One thing Kp is genuinely good for
Because it has been computed identically since 1949, Kp is excellent for comparing across years and across solar cycles. Statements about this decade being more active than the last are usually built on Kp or its close relatives, and they are on firm ground.
It is a climate instrument that people have pressed into service as a weather instrument. That is the whole misunderstanding in one line.
Questions worth answering
What Kp do I need in Tromso?
Lower than you think. Inside the oval, Kp 1 to 2 can put a display overhead on a clear night. Reykjavik and Rovaniemi sit a little further out and benefit from 2 to 3. None of these are thresholds, and none of them override cloud.
The forecast says Kp 5 tomorrow. Should I book?
Check the cloud forecast first. If it is clear, that is a good night regardless of whether Kp lands at 3 or 5. If it is overcast, Kp 5 changes nothing.
Why do apps disagree about Kp?
Because some show the measured value, which only exists after its three-hour window closes, and others show a predicted one. They are different quantities with the same name, which is a reliable source of confusion.
Is a higher Kp always better?
Not if you are already inside the oval. Very high values push the auroral zone southward, and the brightest part of the display can end up south of where you are standing. From Tromso a very large storm can be less impressive than a moderate one.
The G scale, which is a different thing again
Alongside Kp you will see NOAA's G scale, running from G1 to G5. It is not a competing measurement, it is a severity rating for geomagnetic storms, and it maps onto the top half of the Kp range.
| Level | Kp | What it means for you |
|---|---|---|
| G1 minor | 5 | Aurora likely overhead in Tromso, visible lower down the sky from further south |
| G2 moderate | 6 | Strong display at aurora-zone latitudes, visible from northern Britain and Scandinavia generally |
| G3 strong | 7 | Visible well into central Europe and the northern United States |
| G4 severe | 8 | Rare. The events that produce photographs from unexpected places |
| G5 extreme | 9 | Very rare. The 1859 storm is the reference point |
The scale exists for infrastructure operators rather than for tourists: it describes the risk to power grids, satellites and radio, and the aurora is a side effect that happens to be visible.
Which is worth remembering when an app pushes a G1 alert. From inside the auroral oval, G1 is a good evening rather than an event, and the same conditions that make a G1 exciting in Germany make it ordinary in Tromso. It is another version of the same mistake this page is about: a planetary number describing a local experience.
What the professionals actually look at
If you want to follow the same signals a good guide is following on the night, the useful sources are public and free.
The 30-minute aurora forecast. NOAA publishes a map of the oval driven by the OVATION model, fed by solar wind measured at the L1 point about 1.5 million kilometres upstream. The lead time is simply how long the wind takes to cover that distance, which is why it is 15 to 60 minutes rather than hours. This is a nowcast of where the aurora is, not a number describing where it has been.
Bz. The north-south orientation of the interplanetary magnetic field, from the same spacecraft. Sustained negative values mean the field can connect with earth's and energy is loading into the system. If you learn one number to replace Kp, learn this one.
The three-day forecast. NOAA's outlook for the coming days, useful for deciding which night of your trip to prioritise.
Your national met service. Cloud remains the deciding factor, and the Icelandic Met Office in particular publishes a combined aurora and cloud forecast, which is the correct pairing of the two variables.
Notice what these have in common: they are either live measurements with a short horizon, or they are cloud. Kp sits awkwardly between the two, describing the recent past of the whole planet, and that is the reason it disappoints people who use it as a booking signal.
Sources
- GFZ German Research Centre for Geosciences, which produces the official Kp index: kp.gfz.de and the index description. The index was introduced by Julius Bartels in 1949, following the local K index in 1938.
- Matzka, J. et al. (2021), The Geomagnetic Kp Index and Derived Indices of Geomagnetic Activity, Space Weather, doi 10.1029/2020SW002641 — the reference description of what the index is and how it is derived.
- NOAA Space Weather Prediction Center: planetary K-index, 30-minute aurora forecast, 3-day forecast and the NOAA space weather scales for the G ratings.
- Icelandic Met Office, for the combined aurora and cloud forecast: vedur.is.
Data verified on. Index definition and history from GFZ Potsdam, which produces Kp, and from Matzka et al. 2021 in Space Weather. Operational guidance from NOAA SWPC.
The number that actually decides your night
Not Kp. Cloud cover, which nobody publishes by destination and month, and which we do.