You Will Probably See Grey: What the Northern Lights Look Like to the Naked Eye
The world's standard brightness scale for the aurora describes its lowest step as barely visible, about as bright as the Milky Way, with no colour. That step is the common one. Here is what your eye can do with it, and why the trip is still worth taking.

The northern lights, seen with the naked eye, are usually grey. A pale band sitting low in the north, the sort of thing you would take for a smear of cloud until you notice that it has a sharper lower edge than cloud has, and that it is not drifting with the wind the way the real clouds beside it are.
Then somebody in the group holds a phone up, takes a three second exposure, and the screen comes back green. Same sky, same second, two different answers.
That gap is the widest one in this trade, and it is not a scam. It is the physics of your retina, and the brightness of a normal aurora has been written into a meteorological standard for decades. What follows is the arithmetic underneath it: how bright a display actually is, what an eye can do with that amount of light, how often the sky over your head is even open, and why none of it is an argument against going.
Why the northern lights look grey to the naked eye
Human vision runs on two systems that hand over to each other. Above a luminance of about 0.03 candela per square metre the cones are working and you see in colour. Below it you are on rods, which are far more sensitive and cannot encode colour at all. The classic demonstration is exactly the one you will run in a field in Lapland: take a coloured test spot down below that level and the colour drains out of it while the spot itself stays perfectly visible. Between the two lies the mesopic range, where the handover happens gradually and colour is present but weak.
An ordinary aurora sits on the wrong side of that line, or straddles it. The light is there. Your rods pick it up without difficulty, which is why you can see the band at all, trace its shape, and watch it move. What you cannot do is put a colour on it, because the machinery that does colour has already gone off duty.
There is a small cruelty in the arrangement. The aurora's dominant emission is the oxygen green line at 557.7 nanometres, and human sensitivity peaks at around 555, so the sky is glowing at almost exactly the wavelength we are best built to notice. We are still bad at it in the dark. The colours page in the guide goes through where each of those emissions comes from and what altitude it implies.

The camera is not lying, it is being patient
Your eye adds up light over something like a tenth of a second, then starts again from nothing. A camera left open for ten seconds at a high ISO gathers roughly a hundred times as much before it draws a single frame. The green in the resulting picture was really there. It was arriving too slowly for you and fast enough for the sensor.
Which is how the photograph that sold you the trip and the sky above your head can both be honest and look nothing alike. The dishonest pictures are a separate category: impossible saturation, a sharp Milky Way composited into a frame with a bright aurora, a foreground lit with no light source.
The standard scale says the quiet part out loud
The aurora is not only an astronomical object. It is also a meteorological one, and the World Meteorological Organization classifies it among the electrometeors in the International Cloud Atlas, alongside lightning and St Elmo's fire. The section on brightness is short, and the part of it that matters to a traveller is one sentence:
The luminance or brightness of polar aurorae is very variable. It may be faint and barely visible, or it may be comparable with that of clouds illuminated by the full Moon, and, occasionally, it may be much greater.
Occasionally. That word is doing a great deal of work, and it appears in a text that carries the legal status of standard practices and procedures under Annex I to the WMO technical regulations. It is not a blogger being pessimistic about your holiday.
The Atlas then gives four steps. Observers know them as the International Brightness Coefficient, and the Australian Bureau of Meteorology's space weather service publishes the same four with numbers attached, in kilorayleighs. The numbers are the interesting part, because they are logarithmic. Every step up is ten times the light of the step below.
| Step | Brightness | How the standard describes it | What that leaves your eye |
|---|---|---|---|
| I | 1 kR | Faint, barely visible, about the brightness of the Milky Way, minimal colour | A grey or grey-white band. You see the shape and not the colour |
| II | 10 kR | Similar to moonlit cirrus cloud, may have a slight greenish colour | A hint of green in the brightest part, easy to talk yourself into or out of |
| III | 100 kR | Similar to moonlit low cloud, with obvious colour | Green that you would call green without being asked |
| IV | 1000 kR | Strong, bright enough to read by and to cast shadows | The brochure photograph, without needing the camera |
The lowest step of the world's standard aurora brightness scale is defined as barely visible, about as bright as the Milky Way, with minimal colour present. Nothing in the tourism material is written for that step, and it is the one most travellers get.
Here is where we have to stop short of the number you actually want. Nobody publishes a distribution of these four steps over a season at a given place, and we do not have one either. Making one up would put us in the same position as the operators quoting a 90% success rate with no denominator, which is the practice this site exists to complain about.
What can be said is bounded and checkable. The standard itself treats the bright end as occasional. The scale is logarithmic, so the difference between what you are likely to get and what you were shown is a factor of ten or a hundred in light, not a good night versus a slightly better one. And the physiological threshold does not negotiate: below roughly 0.03 cd/m2 there is no colour available to you at any level of enthusiasm.
How often the magnetosphere is even trying
Brightness follows activity, loosely. The planetary Kp index is the usual proxy, and the US Space Weather Prediction Center's viewing guidance is unusually blunt about what each band looks like: at Kp 0 to 2 the aurora is far north and "quite dim in intensity", at Kp 3 to 5 it moves equatorward, brightens and starts to move around.
We calculated how often that happens from the GFZ Potsdam Kp and ap series, which runs from 1932 and is open data. Counting three hour intervals that reach Kp 4 or higher, by month of the aurora season:
| Month | Three hour intervals reaching Kp 4 or more | Days with at least one such interval |
|---|---|---|
| September | 16.7% | 40.7% |
| October | 16.4% | 39.7% |
| November | 12.6% | 33.3% |
| December | 9.7% | 28.8% |
| January | 10.2% | 31.4% |
| February | 14.3% | 37.9% |
| March | 17.4% | 43.5% |
Read the first column as odds. In September, the best month on this measure, roughly one three hour interval in six reaches Kp 4. In December, which is peak season for booking, it is closer to one in ten. Most of the time the planetary index is sitting at 1, 2 or 3, and the display that goes with it is the faint one.
Two caveats belong immediately next to that, and the second one is the more useful of the two. Kp is a three hour average, while a substorm can flare and fade inside twenty minutes, so a quiet index does not rule out a short and vivid show. And Kp is planetary: it is standardised across thirteen mid latitude observatories, and if you are standing underneath the oval it matters far less than people assume. SWPC says so itself, that a person in the right place can see very nice displays at Kp 3 or 4. Our page on the Kp index covers why chasing that number from a hotel room is mostly a way of ruining an evening.
None of which matters if the sky is shut
Colour and activity are the second and third questions. The first is whether there is a hole in the cloud, and that is the variable nobody can influence and almost nobody quantifies. We count a night as usable when cloud cover sat at or below 50% for at least two hours between 18:00 and 02:00, measured across eleven seasons of ERA5 reanalysis. The thresholds are ours and we publish them so you can argue with them.
The result for a short trip is sobering, and it also refuses to behave the way most people's arithmetic assumes. Cloudy nights arrive in blocks. In Tromso, after a clear night the chance of another clear night is 44.3%, and after a cloudy one it is 19.1%. Treating three nights as three independent coin flips overstates your odds by seven points there, and more elsewhere.
| Destination | One night | Three nights | Three nights if they were independent | Nights needed for 90% |
|---|---|---|---|---|
| Tromso | 25.4% | 51.2% | 58.5% | 11 |
| Abisko | 18.7% | 41.2% | 46.3% | 14 |
| Rovaniemi | 31.5% | 59.2% | 67.9% | 9 |
| Reykjavik | 35.7% | 68.6% | 73.4% | 7 |
| Kiruna | 38.8% | 71.2% | 77.1% | 6 |
| Fairbanks | 48.9% | 80.3% | 86.7% | 5 |
| Yellowknife | 47.7% | 80.8% | 85.7% | 5 |
Three nights in Tromso is a coin flip on the cloud alone, before anybody asks whether there was an aurora behind it. Reaching 90% there would take eleven nights, which no realistic trip buys. Kiruna, ninety kilometres from Abisko and rarely marketed as an aurora town, gets to 71.2% in the same three nights. The method, and the places where it breaks down, are set out on the when the sky opens page.
Is that the northern lights, or a grey cloud?
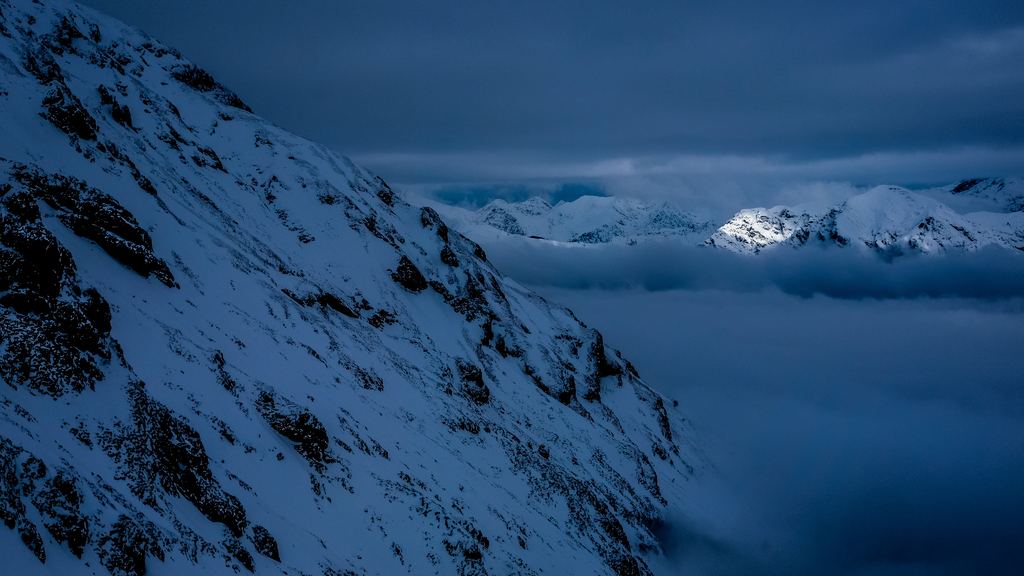
The practical problem with a faint display is not that it is disappointing. It is that people miss it entirely, standing underneath it, because it looks like the weather. Four checks settle it in about a minute.
- Stars. You can see stars through an aurora. You cannot see stars through cloud. This is the fastest test there is and it almost never fails.
- Drift. Cloud moves with the wind, in one direction, at the speed the rest of the sky is moving. An aurora ignores the wind. A quiet arc can hang in the same place for an hour, then brighten and change shape without going anywhere.
- The lower edge. A quiet auroral arc has a defined bottom edge and a top that fades out. Cloud rarely does that, and never that cleanly.
- The phone. Three to five seconds on a tripod or braced against a fence post. Green means aurora, grey means cloud, and the test takes less time than arguing about it.
Why it is still worth standing there
Everything above is an argument about expectations, not an argument against the trip. Four things follow from it, and all four change what you actually see.
The first is time. Dark adaptation is neither instant nor linear. Cone sensitivity improves over the first few minutes, then at around five to eight minutes the rod branch takes over and the threshold falls again, bottoming out near 10 to the minus 5 candela per square metre after about forty minutes in the dark. That last stretch is the difference between noticing a faint arc and standing under one without seeing it. A phone screen at full brightness undoes a good part of it in a second, which is the honest reason a guide asks people to put them away.
The second is where you point your eyes. Rod density is lowest at the very centre of the retina, so the faintest things register better slightly off to one side. Astronomers call it averted vision, and it works on aurora.
Third, the phone is an instrument as well as a souvenir. A five second exposure will tell you whether the grey band overhead is worth waiting under before it does anything, which is worth knowing when it is 20 below and the bus leaves at one.
The fourth is about what you compare the night against. A quiet arc on a clear night, watched for half an hour with adapted eyes, is a better hour than a bright display seen through thin cloud. Neither of them looks like the listing photograph, and only one of those facts is anybody's fault.
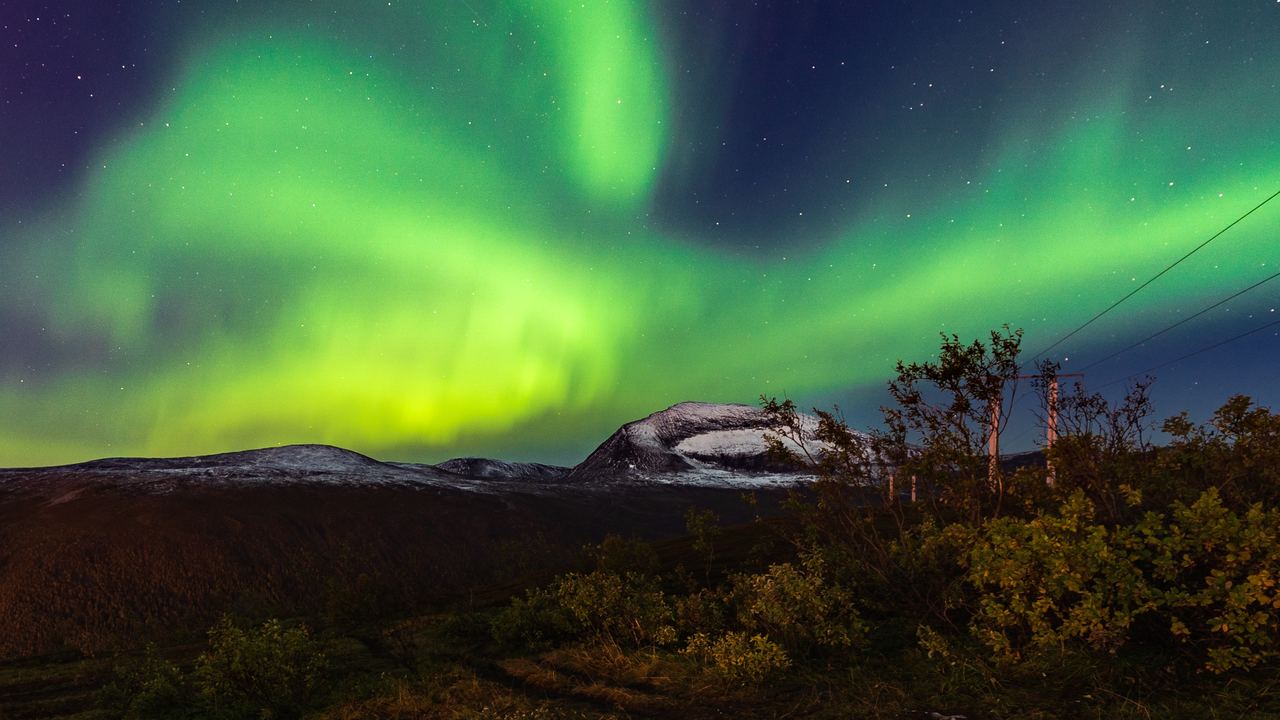
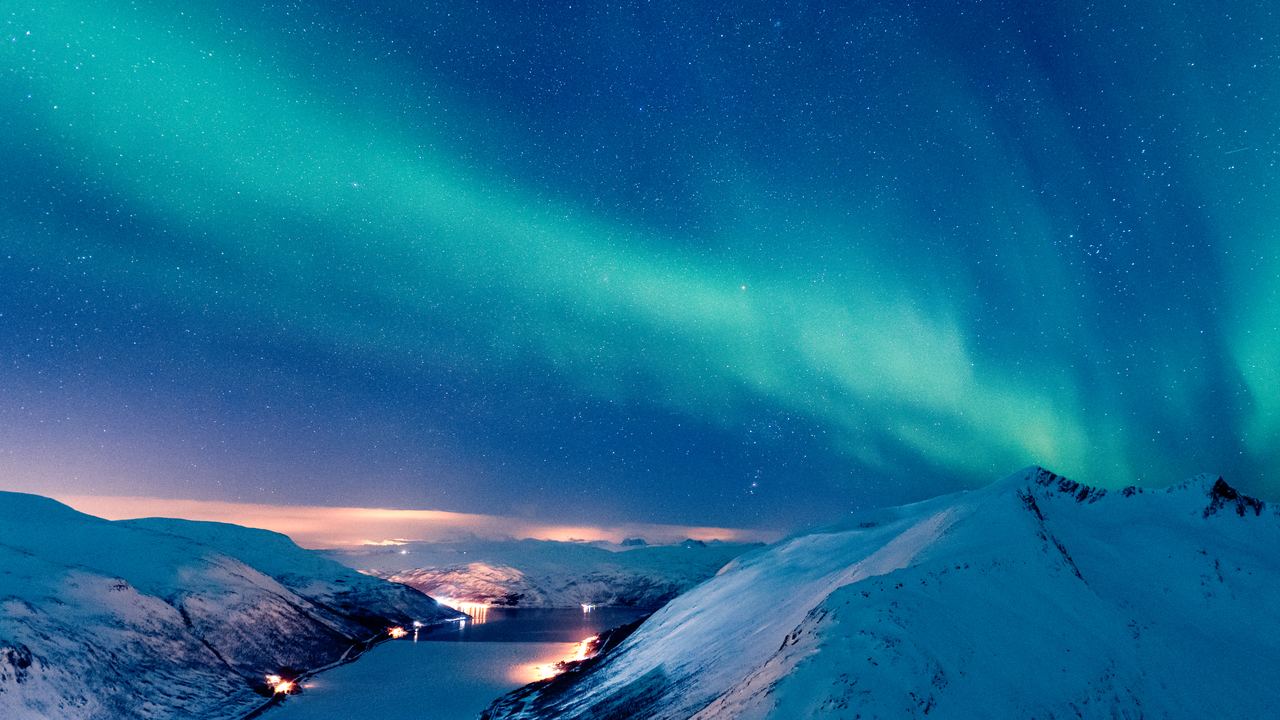
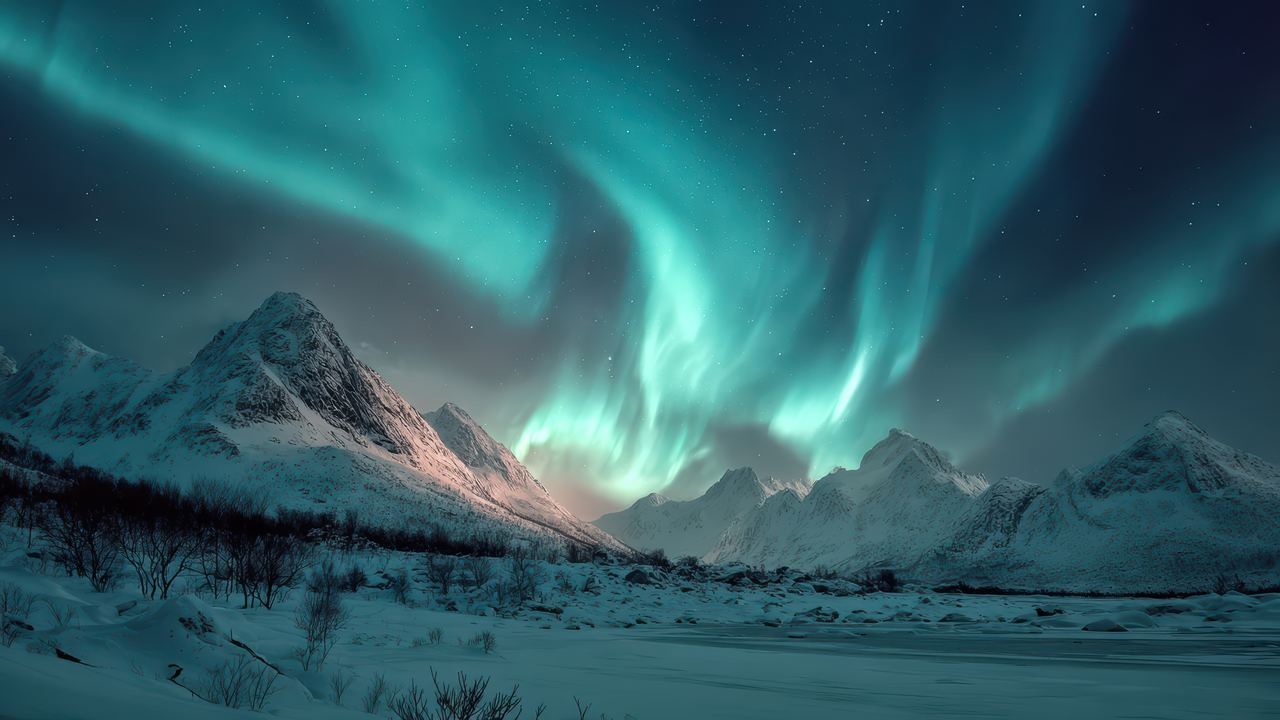
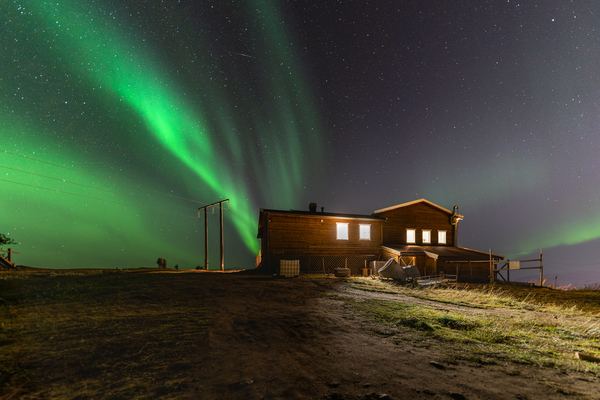
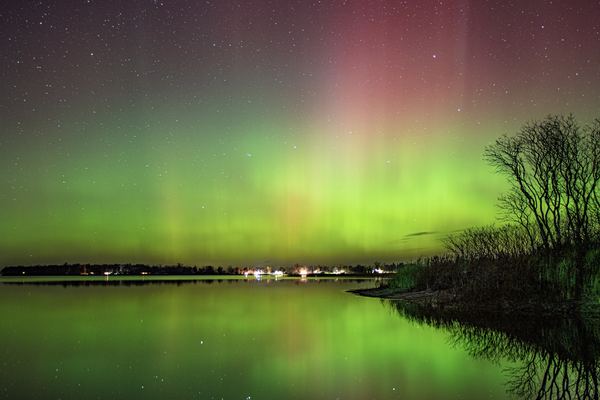
Those three photographs were all made the same way, by holding a shutter open for several seconds. Two of them show a sky that a person standing there would have described in shades of grey. That is not an accusation against the photographer. It is the reason this article exists.
If you are going in the next fortnight
September is a hard month at these latitudes and we have gone through why in some detail: the sky is at its clearest and there is almost no darkness to spend it in, 1.8 hours a night on average in Tromso against 8.0 in December. Two dates in the next few weeks are exact rather than statistical, which makes them the only part of the plan that carries no forecasting risk at all. New moon falls on 11 September 2026 and full moon on 26 September, so the dark half of the month is the fortnight starting now. The autumn equinox is at 00:09 UTC on 23 September, and equinox months carry more geomagnetic activity than solstice months by a factor of 1.41 on mean monthly ap, or 1.71 measured on the frequency of intervals reaching Kp 4. Those are two different metrics and we have quoted both, because an article that publishes one without saying which has published a number nobody can check.
What this article does not establish
- We have no measured distribution of brightness steps over a season, and neither, as far as we can find, does anyone else. "Probably grey" rests on the standard's own wording, on the ten times spacing between steps, and on where the colour threshold sits. It is not a frequency we counted.
- The 0.03 cd/m2 figure is a textbook boundary between cone and rod vision, not a property of the aurora. Individual eyes vary, age matters, and the mesopic handover is gradual rather than a switch.
- Cloud figures come from a reanalysis on a grid of roughly 28 km. Good for climate, useless as a forecast, and blind to a valley microclimate.
- The thresholds in the cloud calculation are ours: 50% cover, two hours, an 18:00 to 02:00 window. Different choices give different numbers.
- A usable sky is not an aurora seen. Every probability in the table above is a ceiling.
- All of it is measured at a fixed point, which is unfair to a tour willing to drive 200 km to get out from under the cloud. That remains the strongest argument for taking one.
Questions about seeing the aurora with your own eyes
What do the northern lights actually look like to the naked eye?
Most often a pale grey or grey-white band, low in the north, with a defined lower edge and a top that fades. On a stronger display you get an obvious green, and on a rare one green with red or purple in it. The shape and the movement are visible at every level. The colour is the part that needs brightness, because colour vision stops working below roughly 0.03 candela per square metre.
Is my camera exaggerating the colour?
No, it is accumulating it. Your eye adds up light over roughly a tenth of a second and then starts again, while a ten second exposure collects around a hundred times as much before producing an image. The green that was too slow for you is comfortably enough for the sensor. Processing usually pushes it further, and heavy saturation is a real problem in tour marketing, but the green itself is recorded rather than painted on.
How bright does an aurora have to be before I see colour?
Roughly the second step of the standard four step scale, which the WMO describes as similar to moonlit cirrus cloud, with a slight greenish colour. Step one, at about a tenth of that brightness, is defined as having minimal colour present. Each step is ten times the light of the one below it, so this is not a matter of a marginally better night.
Does a high Kp number mean I will see colour?
It shifts the odds without deciding anything. Kp is a three hour planetary average built from thirteen mid latitude observatories, none of them inside the auroral oval, so a low value does not rule out a strong local substorm and a high value does not put a display over your particular field. NOAA's own guidance notes that from the right location you can see very good aurora at Kp 3 or 4.
How long do my eyes need to adjust?
The rod branch of dark adaptation starts after about five to eight minutes and the threshold keeps falling for roughly forty minutes before it bottoms out. Most of the useful gain arrives in the first fifteen or twenty. Looking at a bright phone screen resets a large part of it, which is worth knowing before you check the forecast for the fifth time.
Is it cloud or is it aurora?
If you can see stars through it, it is aurora. If it drifts with the wind at the same speed as everything else in the sky, it is cloud. A three to five second phone exposure settles the question immediately: green means aurora.
So how many nights should I book?
More than three, if the budget allows it. On our cloud record three nights in Tromso give a 51.2% chance of even one night with two usable hours, and reaching 90% would take eleven. The same three nights are worth 80.3% in Fairbanks and 80.8% in Yellowknife, which is a difference no amount of choosing the right operator will close.
Aurora tours in Tromso
The destination most of this article's numbers refer to, and the one with the deepest catalogue we carry. A tour that drives is worth more here than anywhere, because Tromso's cloud row is the one that most needs escaping.
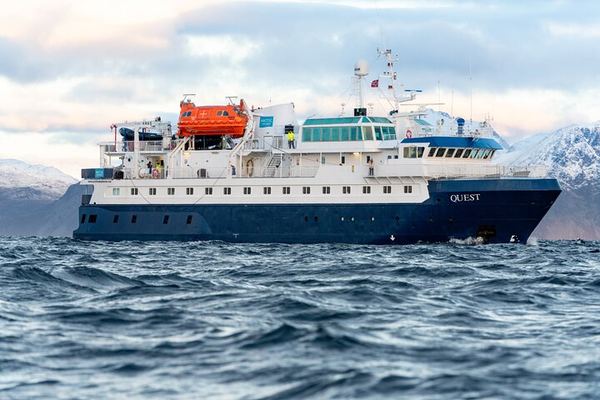
24 Hour Northern Lights and Whale Watching Cruise from Tromso
Sail across the auroral oval in the evening, sleep in a cabin while the ship moves, and wake on the whale grounds. Three-course dinner and lecture on board.
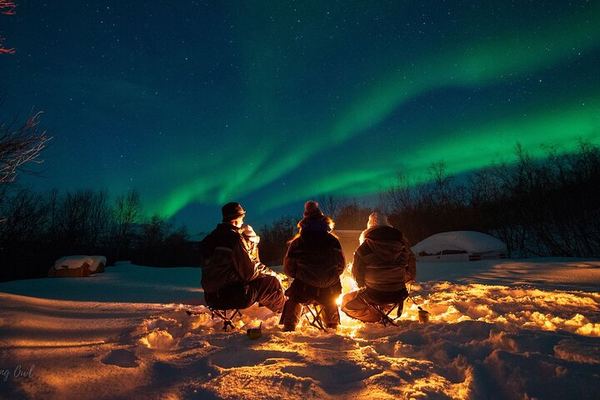
Adults Only Aurora Hunt from Tromso with Wandering Owl
An adults-only northern lights hunt from Tromsø: thermal suits, a campfire and a hot meal while the guides read the night's forecast. Photos included.
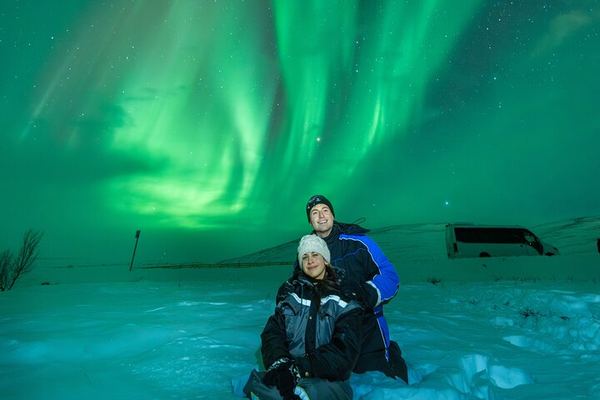
All Inclusive Aurora and Arctic Evening from Tromso with Campfire
Campfire, hot meal and photos on an all-inclusive aurora night from Tromsø. You get a forecast update the morning of, and can rebook if it turns.
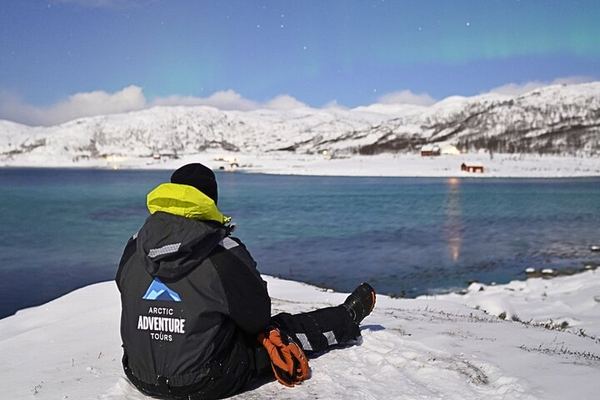
All Inclusive Northern Lights Hunt from Tromso, Max 15 Guests
Up to nine hours hunting clear sky from Tromsø in a group of 15, with a guide and driver working as a pair, an expedition meal and warm gear included.
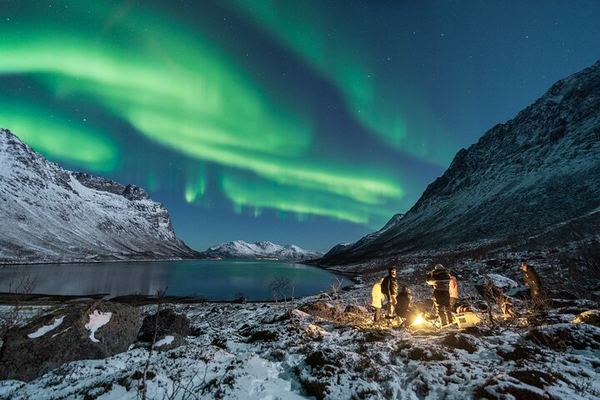
All Inclusive Northern Lights Hunt with The Green Adventure, Photos Included
Thermal suit and meal built into the price, a campfire with marshmallows, and expedition soup made in Tromsø that beats standing closer to the flames.
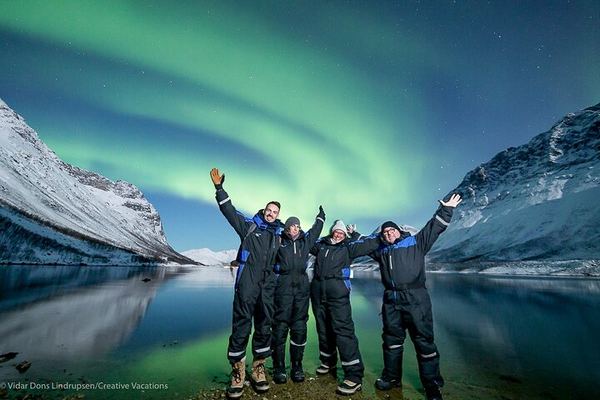
Aurora Adventure Tour from Tromso with Photographer Vidar
Seven hours under Arctic sky with Vidar, a professional photographer: real advice if you brought a camera, your portrait emailed to you if you did not.
Ratings collected by Viator and Tripadvisor
Sources
- Brightness scale and descriptions: World Meteorological Organization, International Cloud Atlas, polar aurora brightness, section 3.2.4.3.1, at cloudatlas.wmo.int. The shaded text there is Annex I to the Technical Regulations, WMO No. 49.
- Kilorayleigh values for the four steps: Australian Bureau of Meteorology, Space Weather Services, Characterising the Aurora, at sws.bom.gov.au.
- Cone and rod thresholds, dark adaptation: Michael Kalloniatis and Charles Luu, Light and Dark Adaptation, in Webvision, Moran Eye Center, University of Utah, at webvision.med.utah.edu. The 0.03 cd/m2 duplicity boundary, the five to eight minute rod branch and the forty minute asymptote are taken from that page.
- Kp bands and what they look like: NOAA Space Weather Prediction Center, Tips on Viewing the Aurora, at swpc.noaa.gov.
- Geomagnetic frequencies: computed by us from the GFZ Potsdam Kp and ap series, 1932 to 2026, open data.
- Cloud and darkness: ERA5 reanalysis, produced by ECMWF for the Copernicus Climate Change Service, queried through the Open-Meteo historical archive, eleven seasons from 1 September 2015 to 30 April 2025. Moon phases and the equinox from standard ephemeris algorithms.
- Every link above was requested and returned a page on 9 September 2026.
Data verified on. Brightness scale from the WMO International Cloud Atlas, kilorayleigh values from the Australian BOM, vision thresholds from Webvision. Cloud from ERA5, geomagnetic data from GFZ. About This Site
The number that decides your trip is cloud, not Kp
How often the sky opens in each destination, the thresholds we used, and the four things the measurement cannot see.