The Three Best Aurora Seasons in Thirty-One Years Were All on the Way Down
The sun peaked in October 2024 and the trade has been selling "last chance" ever since. Ranked on the open geomagnetic record, the three most active aurora seasons of the last thirty-one all came after a maximum rather than at one. The ranking, and its window.

Somewhere in the last two years the aurora industry decided the best aurora seasons were behind us. The sun peaked in October 2024, the marketing moved from once in a generation to last chance, and the message to anyone booking now is that they have turned up late to something already finished.
The record disagrees, and it is a record anyone can download. Geomagnetic activity has been measured continuously since 1932 and published as open data. Ranked by that measurement, the three most active aurora seasons of the last thirty-one all happened after a solar maximum rather than during one. Two of them followed the peak of Cycle 23. The third was last winter.
The three best aurora seasons since 1996 all came after a peak
A season here runs September to March, because that is the stretch of the year you can stand outside in real darkness at high latitude. The measurement is the mean daily Ap index across those seven months.
Ap is the daily average of the same three-hourly observations that produce the Kp number on your aurora app, converted to a linear scale. Kp is quasi-logarithmic, so averaging Kp values gives a figure that means nothing in particular; Ap is what you average instead. The series is maintained at the Niemegk observatory by GFZ Potsdam, runs unbroken since 1932, and is published under an open licence, which is what makes the comparison below possible at all.
| Rank | Since 1996 | Mean Ap | Whole record from 1932 | Mean Ap |
|---|---|---|---|---|
| 1 | 2003-04 | 20.91 | 1951-52 | 25.79 |
| 2 | 2002-03 | 16.87 | 1957-58 | 23.68 |
| 3 | 2025-26 | 16.44 | 1982-83 | 22.89 |
| 4 | 1999-00 | 14.25 | 1991-92 | 22.41 |
| 5 | 2004-05 | 14.16 | 1960-61 | 21.74 |
| 6 | 2000-01 | 13.66 | 2003-04 | 20.91 |
Cycle 23 reached its maximum around 2000 and 2001. Its strongest aurora season on this measure was 2003-04, three years later. That was the winter of the Halloween storms, when an X17 flare on 28 October 2003 was followed by an X10 the next day and aurora was reported far outside its usual range. Second place, 2002-03, sits on the same downslope.
Cycle 25 reached maximum in October 2024 at a smoothed sunspot number of 160.8, comfortably past the 115 the official prediction panel had forecast. The first complete season after that peak was 2025-26, and it lands third since 1996. It contained the severe storm of 12 November 2025, which NOAA rated G4 and which reached Kp 9 minus.
Now the part a headline would leave out. Those are the three best seasons of the last thirty-one, and only of the last thirty-one. Widen the window to the whole record and six seasons beat 2003-04, all of them between 1950 and 1992, when the cycles themselves ran stronger. Anyone writing the best aurora years on record is simply wrong, and the accurate claim is narrower and still worth having: within the era most travellers can remember, the top of the ranking belongs to the declining phase.
The argument was never about absolute numbers. It is about where in the cycle those seasons sat.
All three of the top seasons since 1996 happened after a solar maximum, not at one. The peak is not the part of the cycle where the aurora is best.
Why a declining sun still produces aurora
Two different things cause geomagnetic storms, and they do not peak together.
Coronal mass ejections are eruptions. They need the tangled magnetic fields that come with sunspots, so their count tracks the sunspot count and drops away after maximum. These are the enormous, unannounced events that put aurora over England and Alabama.
Coronal holes are the opposite. They are open regions where the magnetic field lets the solar wind escape at high speed, they grow large and long-lived during the declining phase, and the fast stream one of them releases piles into the slower wind ahead of it and drives a storm of its own. Because the sun turns roughly once every 27 days as seen from here, the same hole can point at us again a month later, and again after that.
Which is why the distribution of geomagnetic disturbance across a solar cycle has two humps rather than one: an early peak near sunspot maximum from eruptions, then a second during the descent, from these recurring streams. It is one of the older results in the field, established from the coronal hole observations of the mid 1970s and reproduced in every cycle since. Our solar cycle page goes through the mechanism properly.
Here is where our reading parts company with the cheerful version of this argument. Coronal hole storms are usually moderate ones, G1 and G2 on the NOAA scale, with the occasional bigger event. They are not what puts the aurora over a garden in Kent, and if that was the plan, the good years really are behind you for a while.
At sixty-nine degrees north none of that applies. Tromsø, Alta, Kiruna and Fairbanks sit under or beside the auroral oval, where a quiet night at Kp 2 still shows something to anyone outside with dark-adapted eyes. A declining sun is a poor reason to sit at home waiting for a storm and a perfectly good season to travel north. Those are two different questions, and the industry keeps answering them as one.

The cycle sets the odds. The sky settles them
Sort the same record by calendar month instead of by season and a second pattern turns up, one that has nothing to do with which year you go.
| Month | Mean Ap | Deviation | Intervals at Kp 4 or above |
|---|---|---|---|
| September | 15.68 | +17.5% | 16.7% |
| October | 14.82 | +11.0% | 16.4% |
| November | 12.73 | -4.6% | 12.6% |
| December | 10.62 | -20.4% | 9.7% |
| January | 11.49 | -13.9% | 10.2% |
| February | 13.57 | +1.7% | 14.3% |
| March | 15.93 | +19.4% | 17.4% |
March and September are the two maxima. December is the weakest month of the year, which is awkward, because December is high season. The mechanism is geometry rather than the sun: near the equinoxes the tilt of the earth's magnetic axis lets the interplanetary field couple more efficiently with ours. Russell and McPherron described it in 1973 and it has been in the textbooks ever since.
The trade summarises this as roughly twice the activity at the equinoxes, and almost nobody says twice as much of what. It matters. On mean monthly Ap the equinox months run 1.41 times the solstice months across the whole record. On the frequency of three-hour intervals reaching Kp 4 or above, the ratio is 1.71. Both are correct. The tail of the distribution stretches further than the middle does, so a threshold count grows faster than an average does. The figure that circulates is compatible with the threshold reading, not with the average one, and a number that does not say which it is cannot be checked by anybody.
The constraint is cloud, not the sun
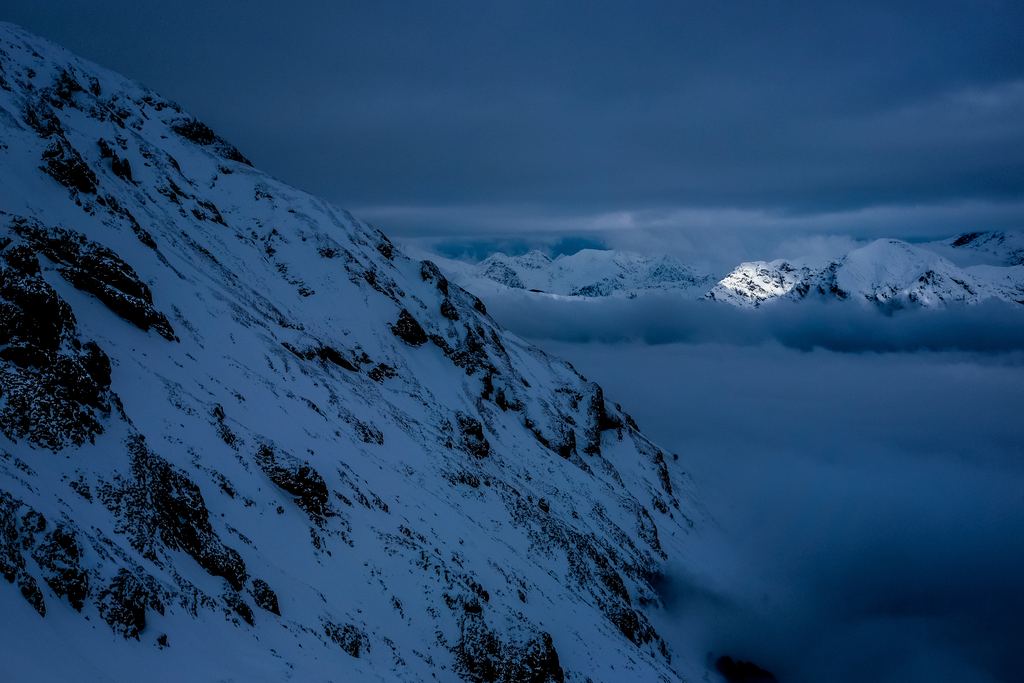
None of this survives an overcast week, and that is the part the solar cycle argument tends to skip.
On eleven seasons of ERA5 reanalysis, Tromsø gives a usable sky, meaning cloud cover at or below 50% for at least two hours between 18:00 and 02:00, on 25.4% of nights across the season. Three nights there work out at a 51.2% chance of catching at least one, once you allow for the fact that cloudy nights arrive in blocks rather than independently.
A strong solar season does not move that number at all. The sun decides how much there is to see; the sky decides whether you see it.
Where a declining-phase season is best spent
If the sun is going to be moderately active and fairly reliably so, the sensible response is to spend the trip where the other two variables are least hostile. We fold all three into one figure per destination and month:
expected useful hours = (nights with a usable sky ÷ 100) × hours of astronomical darkness × that month's mean Ap divided by the annual mean
It is not a probability and does not pretend to be. It multiplies three averages as though they were independent, which cloud and darkness are not, and the unit it produces is closer to useful hours in a night of that month, adjusted for how lively that month tends to run. What it is good for is ranking, and the ranking is not the one the market sells.
The season, by the three-factor index
Peak months are where cloud, darkness and geomagnetic activity line up best for that destination. Every one of these rows is calculated, not chosen.
| Month | 1 | 2 | 3 | 4 | 5 | 6 | 7 | 8 | 9 | 10 | 11 | 12 |
|---|---|---|---|---|---|---|---|---|---|---|---|---|
| TromsøOctober scores 2.27 on the index against 1.07 in December, which is the month everyone books. | 1 | 2 | 3 | 4 | 5 | 6 | 7 | 8 | 9 | 10 | 11 | 12 |
| AltaBeats Tromsø on usable sky in all seven months of the season, and has five tours to Tromsø's seventy-four. | 1 | 2 | 3 | 4 | 5 | 6 | 7 | 8 | 9 | 10 | 11 | 12 |
| KirunaThe strongest row in Scandinavia, and it beats Abisko 90 km west on usable sky every month, never by less than 16 points. | 1 | 2 | 3 | 4 | 5 | 6 | 7 | 8 | 9 | 10 | 11 | 12 |
| RovaniemiMarch is the best month of its own row at 50.0% of nights with a usable sky, and it is low season. | 1 | 2 | 3 | 4 | 5 | 6 | 7 | 8 | 9 | 10 | 11 | 12 |
| ReykjavíkThe most consistent sky in Europe month to month, paid for with fewer dark hours than the mainland. | 1 | 2 | 3 | 4 | 5 | 6 | 7 | 8 | 9 | 10 | 11 | 12 |
| FairbanksMidwinter is the best time of the year here, which is the reverse of the Scandinavian advice. | 1 | 2 | 3 | 4 | 5 | 6 | 7 | 8 | 9 | 10 | 11 | 12 |
| YellowknifeReaches 61.6% of nights with a usable sky in March, the highest figure anywhere in our data. | 1 | 2 | 3 | 4 | 5 | 6 | 7 | 8 | 9 | 10 | 11 | 12 |
Cloud from ERA5 via Open-Meteo, 2015-2025; darkness from ephemerides; Ap from GFZ, 1932-2026. A ranking aid, not a probability: it ignores the moon and the cold.
Two things fall out of that grid, and neither is what a tour listing would tell you.
October and November win at Tromsø, Alta, Bodø, Kiruna and Akureyri, and nobody sells them. And the small towns beat the famous ones. Alta scores above Tromsø on usable sky in all seven months of the season. Kiruna beats Abisko in all seven, never by less than sixteen percentage points and by twenty-nine in March. The tours are concentrated in Tromsø and Rovaniemi because that is where the flights and the beds are, which is a genuine reason, and a different reason from where the sky opens.
We have no stake in that either way, which is the whole point of publishing it. If you are booking anyway, the useful order of decisions is month first, destination second, operator third. Most people do it backwards.

What this does not tell you
- Activity is not aurora seen. Ap measures how disturbed the earth's magnetic field was. It says nothing about whether anyone was outside, awake, or under a clear sky at the time.
- Kp and Ap are planetary averages from thirteen observatories between 44 and 60 degrees of geomagnetic latitude. Not one of them is arctic. Inside the auroral oval the index matters much less than people think, which we go through on the Kp index page.
- A season ranking says nothing about a night. Kp is a three-hour average and a substorm can be over in twenty minutes. A quiet index does not rule out a good hour.
- The cloud figures are ERA5 on a grid of about 28 km, not a weather station. That resolution is why we say what we cannot see around Abisko rather than claiming to have measured it.
- The declining phase is a slope, not a plateau. Activity trends down from here until roughly 2030. Sooner is better than later, and that is an argument about odds, not urgency.
Questions we get about this
Is it too late to see the northern lights now that solar maximum has passed?
Not at high latitude. The three most active aurora seasons of the last thirty-one, measured by mean daily Ap from September to March, all fell after a solar maximum rather than at one. What genuinely has passed is the window for seeing aurora from southern England or the American Midwest, which needs the severe storms that come with a spotty sun.
Was last season really one of the best?
On our calculation 2025-26 ranks third since 1996 by mean daily Ap across September to March, at 16.44. It is not third of all time. On the full record since 1932 there are six seasons above it, all between 1950 and 1992, which we would rather tell you than let the ranking travel without its window.
Should I wait for the next solar maximum instead?
Cycle 26 is not expected to reach maximum until the mid 2030s. If the question is about this decade, waiting means arriving nearer the minimum, not nearer the peak.
Does a low Kp forecast mean I should stay in?
Kp is a three-hour planetary average taken at latitudes well south of the arctic. Under the oval, a substorm lasting twenty minutes can produce a display that never shows up in that number. Cloud cover is the forecast worth reading; Kp is the one worth ignoring more often than most apps suggest.
Which is the better season to book, 2026-27 or 2027-28?
Both should sit above anything between 2017 and 2023, and the trend from here is downward. The difference between the two seasons is smaller than the difference between going in October and going in December, so pick the month first.
Can I check these rankings myself?
Yes, and that is the point of publishing the method. The Kp and ap series is free to download from GFZ Potsdam under a CC BY licence, it goes back to 1932, and the calculation is a mean of the daily Ap values from 1 September to 31 March. Nothing in the table above needs anything we have not named.
Aurora tours in Tromsø
The deepest catalogue on this site, in the city our own data says is beaten on sky by its smaller neighbour. Both things are true, and worth knowing before you book.
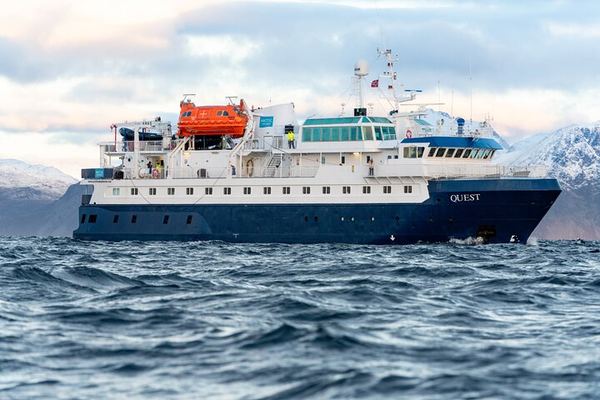
24 Hour Northern Lights and Whale Watching Cruise from Tromso
Sail across the auroral oval in the evening, sleep in a cabin while the ship moves, and wake on the whale grounds. Three-course dinner and lecture on board.
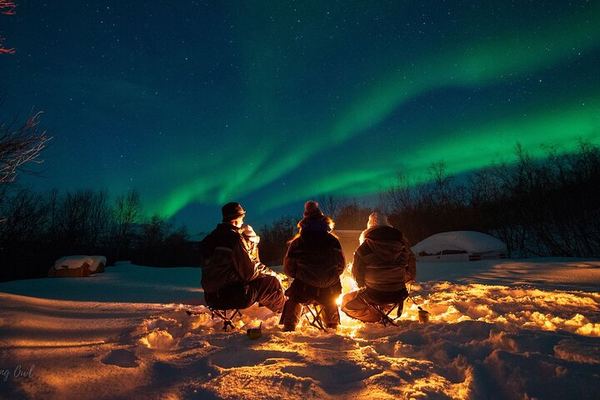
Adults Only Aurora Hunt from Tromso with Wandering Owl
An adults-only northern lights hunt from Tromsø: thermal suits, a campfire and a hot meal while the guides read the night's forecast. Photos included.
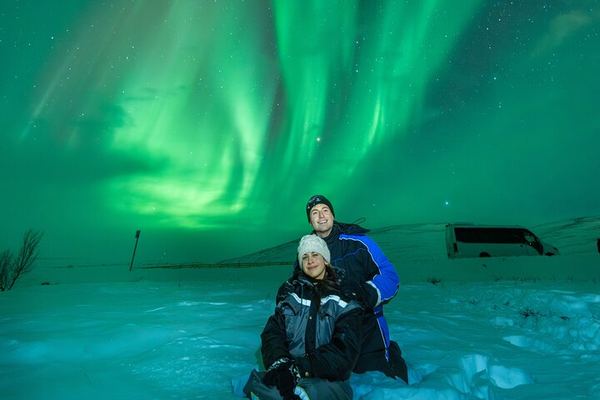
All Inclusive Aurora and Arctic Evening from Tromso with Campfire
Campfire, hot meal and photos on an all-inclusive aurora night from Tromsø. You get a forecast update the morning of, and can rebook if it turns.
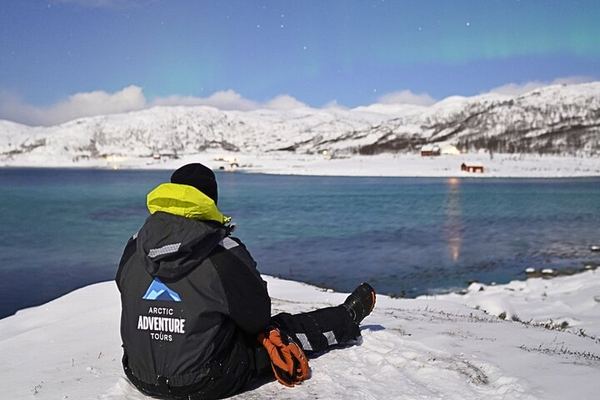
All Inclusive Northern Lights Hunt from Tromso, Max 15 Guests
Up to nine hours hunting clear sky from Tromsø in a group of 15, with a guide and driver working as a pair, an expedition meal and warm gear included.
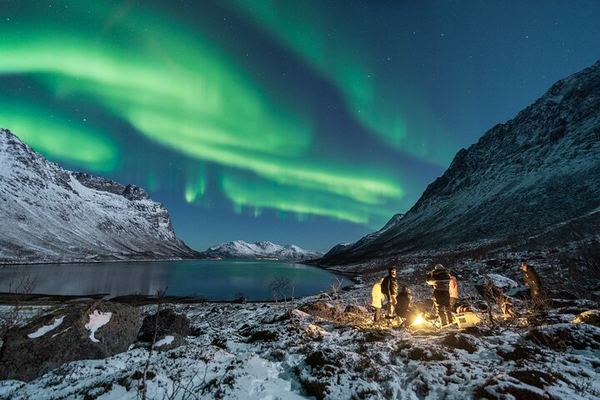
All Inclusive Northern Lights Hunt with The Green Adventure, Photos Included
Thermal suit and meal built into the price, a campfire with marshmallows, and expedition soup made in Tromsø that beats standing closer to the flames.
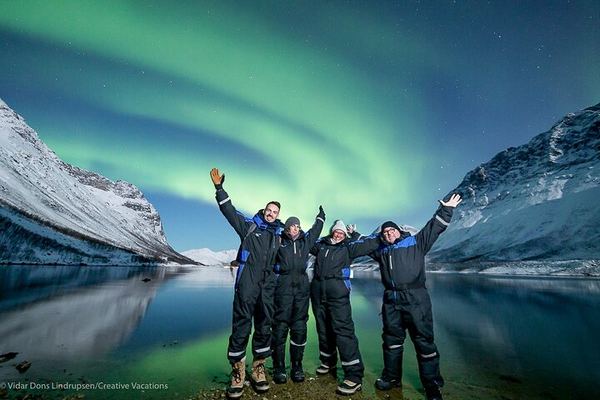
Aurora Adventure Tour from Tromso with Photographer Vidar
Seven hours under Arctic sky with Vidar, a professional photographer: real advice if you brought a camera, your portrait emailed to you if you did not.
Ratings collected by Viator and Tripadvisor
Sources
- Geomagnetic indices: the Kp and ap series maintained by GFZ Potsdam at the Adolf Schmidt Geomagnetic Observatory, Niemegk, continuous since 1932 and published under CC BY 4.0. Data publication: Matzka, J., Bronkalla, O., Tornow, K., Elger, K. and Stolle, C. (2021), Geomagnetic Kp index, GFZ Data Services, doi 10.5880/Kp.0001. Method paper: Matzka et al. (2021), Space Weather, doi 10.1029/2020SW002641.
- Solar cycle status: NOAA solar cycle progression and NASA, including the October 2024 maximum at a smoothed sunspot number of 160.8 against a forecast of 115.
- The equinox effect: Russell, C. T. and McPherron, R. L. (1973), on the semiannual variation of geomagnetic activity, Journal of Geophysical Research, doi 10.1029/JA078i001p00092.
- Cloud: ERA5 reanalysis (ECMWF, Copernicus Climate Change Service), queried through the Open-Meteo historical archive; dataset at the Copernicus Climate Data Store. Thresholds and window as stated above.
- Darkness and moon: calculated from standard ephemeris algorithms, with no external dataset. Astronomical darkness is the sun below 18 degrees.
- Our own working: the season rankings, the monthly table and the three-factor index are ours, recomputed from the sources above. The full method, including the thresholds we chose and where they bite, is on the cloud page of the guide.
Data verified on. Season rankings and monthly figures computed from the GFZ Potsdam Kp/ap series, 1932-2026. Cloud from ERA5 via Open-Meteo, 2015-2025. Full source list in the section above.
The cycle sets the odds for a season
Where Cycle 25 has got to, why a declining phase is not the same as a quiet one, and what that means for the next two winters.