The Northern Lights Equinox Effect Is Real: 1.71×, or 1.41×, Depending on What You Count
The trade says activity roughly doubles at the equinoxes and never says what it measured. On ninety-four years of GFZ data there are two right answers, 1.41x and 1.71x, and the gap between them is the whole story. Plus the reason the bonus does not save September.
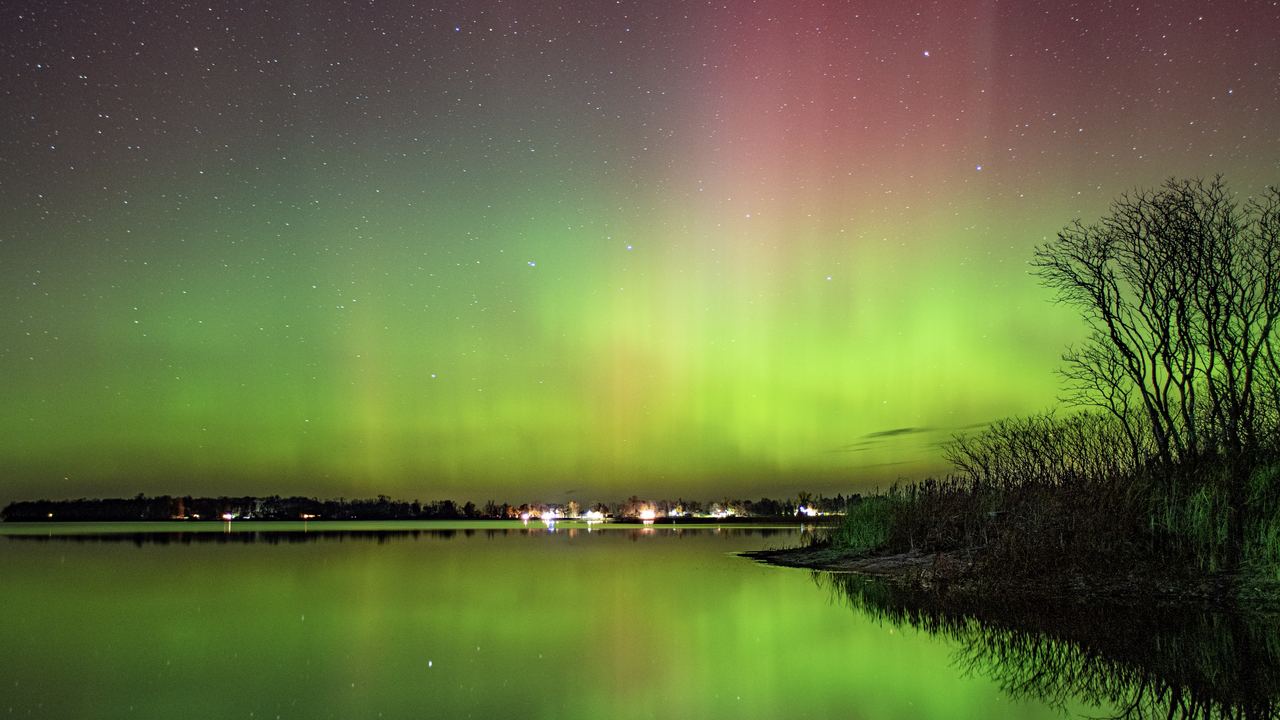
The northern lights equinox is the rare piece of aurora folklore that survives contact with the data. Activity really does rise around the two equinoxes and really does sag at the solstices, and anyone with a spreadsheet and an afternoon can confirm it on ninety-four years of open records.
What does not survive is the number attached to it. Our own survey of this market, recorded in August 2026, kept turning up the same sentence: activity is roughly double at the equinoxes, credited to NASA and NOAA in general and to no dataset in particular. Nobody publishes the table. So we built it, out of the Kp and ap series that GFZ Potsdam has kept since 1932, and the answer turns out to be more interesting than the claim.
There are two right answers. On average magnetic disturbance, the equinox months of March and September run 1.41 times the solstice months of June and December. On the count of genuinely stormy three hour intervals, Kp 4 and above, they run 1.71 times. Both come out of the same file. Both are correct. An article that prints one of them without saying which is doing the exact thing this site was set up to stop.
Then there is the part that costs us something to publish. The equinox effect is real, it is measurable, and it is not large enough to make September a good month to travel in. On our own index it changes the ranking of one destination out of fourteen.
What the northern lights equinox effect actually is
The Sun's magnetic field arrives here wrapped in the solar wind, and how much of it gets past our own field depends on how the two line up. Around the equinoxes that geometry improves. The interplanetary field is organised in the Sun's equatorial frame while the magnetosphere answers to its own, and twice a year the angle between the two produces a southward component that couples more efficiently. More coupling means more energy into the magnetosphere, which means more aurora.
That is the Russell-McPherron effect, named for the 1973 paper by Christopher Russell and Robert McPherron, Semiannual variation of geomagnetic activity, in the Journal of Geophysical Research, volume 78, page 92. It is not the only mechanism ever proposed for the semiannual pattern, and the literature still argues about how much of the variation it accounts for on its own. The pattern is not in dispute. Fitted curves peak in March and September and bottom out in June and December, which is what our own table does below. The physics of the whole chain is on the guide page about what causes the northern lights.
How long this has been known, and how long it has been checkable
Four dates that decide what anyone is allowed to say about the equinox and the aurora.
The origins
1932
The record starts
The Kp and ap series kept by GFZ Potsdam begins: eight readings a day plus a daily index of how disturbed Earth's magnetic field was. Ninety-four complete years later it is still the long baseline everything else is measured against, and it is open data with no key and no account.
The growth
1973
Russell and McPherron publish the mechanism
Semiannual variation of geomagnetic activity, in the Journal of Geophysical Research. It gives the equinox pattern a physical explanation rather than a statistical one, and it is the paper every aurora page is loosely referring to when it says the equinoxes are better.
1996
The window most space weather work uses
Restrict the record to the last thirty years and the two ratios move in opposite directions: the average ratio falls to 1.34 and the threshold ratio rises to 1.79. Same effect, different window, different headline number.
Today
October 2024
Solar cycle 25 passes its maximum
Which matters less than the trade suggests. Of the last thirty-one aurora seasons the three most active by mean ap were all on the declining side of a cycle, and 2025-26 was one of them.
2026
We run it ourselves
Ninety-four years of the series, recomputed on three different metrics, with the code and the thresholds published so the result can be argued with rather than believed.
Ninety-four years of Kp, month by month
Here is the whole record, by calendar month. Ap is the daily index of magnetic disturbance, averaged over every day of that month since 1932. The third column counts three hour intervals that reached Kp 4 or above, the conventional line between an active period and a quiet one. The fourth counts the days on which that happened at least once.
| Month | Mean ap | Against the annual mean | Intervals at Kp 4+ | Days with at least one Kp 4+ |
|---|---|---|---|---|
| January | 11.49 | -13.9% | 10.2% | 31.4% |
| February | 13.57 | +1.7% | 14.3% | 37.9% |
| March | 15.93 | +19.4% | 17.4% | 43.5% |
| April | 15.42 | +15.5% | 16.5% | 41.2% |
| May | 13.24 | -0.8% | 12.4% | 32.4% |
| June | 11.80 | -11.6% | 10.3% | 29.3% |
| July | 11.97 | -10.3% | 10.0% | 29.1% |
| August | 12.88 | -3.5% | 12.0% | 32.5% |
| September | 15.68 | +17.5% | 16.7% | 40.7% |
| October | 14.82 | +11.0% | 16.4% | 39.7% |
| November | 12.73 | -4.6% | 12.6% | 33.3% |
| December | 10.62 | -20.4% | 9.7% | 28.8% |
March is the most disturbed month of the year, 19.4% above the annual mean. September comes second at 17.5%. December is the quietest month there is, 20.4% below the mean, and December is when this industry does most of its business. That is not a scandal, it is a school calendar. But the month with the highest prices is also the month with the least magnetic activity and, at Tromsø, the least open sky of the whole season.
Notice what the table does not show. The equinox peaks are not spikes sitting on 20 March and 23 September. They are broad and they lean: April is the third most active month of the year and October the fourth. You can book a month either side of an equinox and keep most of the effect, which is useful, because a month either side is where the darkness lives.

So is it 1.71 times, or 1.41 times? Both
The ratio between the equinox months and the solstice months depends entirely on what you decide to count, and the three obvious choices give three different answers.
| What is being measured | Whole series, 1932 to 2026 | From 1996 |
|---|---|---|
| Mean monthly ap | 1.41x | 1.34x |
| Frequency of intervals at Kp 4+ | 1.71x | 1.79x |
| Days with at least one Kp 4+ | 1.45x | 1.55x |
The average rises by 41%. The count of stormy intervals rises by 71%. Those are not in conflict, they are a description of the shape of the thing: the tail stretches further than the centre moves. Equinox months are not uniformly livelier. They hold more of the nights that are worth standing outside for, which happens to be both the more useful fact and the bigger number, so it is the one the marketing reaches for.
The roughly double in circulation is compatible with the threshold metric and not with the average. We are not calling it false. We checked it, which is a stronger position than denying it, and the only thing missing is a sentence saying which of the three rows is meant.
The right hand column deserves its own look. Cut the record down to 1996 onwards and the threshold ratio climbs to 1.79 while the average ratio drops to 1.34. The two metrics move in opposite directions on the same data. A ratio published without its window is half a number.
Equinox months run 1.41 times the solstice months on average activity and 1.71 times on the count of stormy intervals. Both are right. The gap between them is the tail of the distribution, and the tail is the only part a traveller ever sees.
Why the northern lights equinox does not rescue September
Here is the part a company selling September departures cannot write, and the reason we go to the trouble.
An aurora you can actually see needs three things at the same time: a disturbed magnetosphere, a gap in the cloud, and darkness to look through. Remove any one and the other two are worth nothing. The equinox improves the first. September wrecks the third.
At Tromsø in September the sun spends an average of 1.8 hours a night below eighteen degrees inside our 18:00 to 02:00 window. In December it spends the full eight. No 17.5% bonus on magnetic activity closes a gap that size. Alta is worse still at 1.7 hours, and Alta and Tromsø also have the fewest moon free nights of their whole season in September, 13% and 17%.
So we multiply all three together: nights of usable sky from eleven seasons of ERA5 cloud, times hours of true darkness, times the month's mean ap divided by the annual mean ap. The unit stays readable, expected usable hours adjusted for how lively that month tends to be, and it is emphatically not a probability.
| Destination | Sep | Oct | Nov | Dec | Jan | Feb | Mar | Best month |
|---|---|---|---|---|---|---|---|---|
| Tromsø | 0.71 | 2.27 | 1.51 | 1.07 | 1.61 | 1.58 | 1.19 | October |
| Alta | 0.71 | 2.44 | 1.75 | 1.70 | 1.78 | 2.07 | 1.33 | October |
| Bodø | 1.17 | 2.42 | 2.70 | 1.66 | 1.86 | 2.12 | 1.82 | November |
| Reykjavík | 1.31 | 1.94 | 2.26 | 2.12 | 1.84 | 1.62 | 1.38 | November |
| Akureyri | 0.80 | 1.43 | 1.38 | 1.04 | 1.12 | 1.19 | 1.24 | October |
| Rovaniemi | 1.37 | 2.25 | 1.45 | 1.42 | 1.49 | 1.93 | 2.55 | March |
| Levi | 1.09 | 2.12 | 1.64 | 1.40 | 1.84 | 1.81 | 2.29 | March |
| Saariselkä | 0.86 | 1.99 | 1.25 | 1.31 | 1.41 | 1.49 | 2.16 | March |
| Kiruna | 1.30 | 2.69 | 2.71 | 1.91 | 2.16 | 2.72 | 2.84 | March |
| Abisko | 0.74 | 1.40 | 0.93 | 0.86 | 0.97 | 1.28 | 1.23 | October |
| Fairbanks | 1.62 | 2.92 | 2.78 | 2.84 | 3.46 | 3.07 | 2.45 | January |
| Anchorage | 1.76 | 2.48 | 2.28 | 1.42 | 1.67 | 2.20 | 2.49 | March |
| Yellowknife | 2.60 | 2.41 | 2.05 | 2.50 | 3.00 | 3.71 | 3.30 | February |
| Whitehorse | 1.93 | 2.12 | 1.59 | 1.66 | 1.84 | 2.50 | 2.11 | February |
September is the weakest month of the season in twelve of the fourteen places we measure. Yellowknife bottoms out in November instead, and so does Whitehorse, and Whitehorse is the one worth looking at: on cloud and darkness alone its weakest month is September too. Adding the equinox bonus to the sum reorders exactly one destination in fourteen. That is the honest size of this effect for somebody choosing a month to fly in.
The arithmetic is there to be checked. Tromsø has 1.34 expected usable hours in December before the adjustment, December's factor is 0.796, and 1.34 times 0.796 is the 1.07 in the table. Every cell works that way. The columns are rounded to two places while the index itself is computed before rounding, so a hand check can land a hundredth away.
Everywhere else the order does not budge. Tromsø still peaks in October at 2.27, more than double its December. Alta still has more open sky than Tromsø in every month of the season, and Kiruna more than Abisko in every month of the season, and neither of those two towns has a tour catalogue to match its neighbour's. The equinox effect is real, and next to cloud and darkness it is a second order term, which is close to the opposite of the billing it gets.
Where the equinox months actually pay, and where they do not
Highlighted months are the strongest on the index above, which combines open sky, real darkness and the geomagnetic season. It is a product of averages, not a probability, and it deliberately leaves the moon out.
| Month | 1 | 2 | 3 | 4 | 5 | 6 | 7 | 8 | 9 | 10 | 11 | 12 |
|---|---|---|---|---|---|---|---|---|---|---|---|---|
| TromsøSeptember gets the geomagnetic bonus and 1.8 hours of darkness to spend it in, which is why it scores 0.71 against October's 2.27. December is the famous month and the second weakest on the row. | 1 | 2 | 3 | 4 | 5 | 6 | 7 | 8 | 9 | 10 | 11 | 12 |
| RovaniemiMarch is the single best destination month in Finnish Lapland on this index, 2.55: the most active month of the year lands on the clearest sky of the season, 50.0% of nights, in low season. | 1 | 2 | 3 | 4 | 5 | 6 | 7 | 8 | 9 | 10 | 11 | 12 |
| KirunaStrong from October to March and better than Abisko, 90 km west, in every month of the season. March tops the row at 2.84. | 1 | 2 | 3 | 4 | 5 | 6 | 7 | 8 | 9 | 10 | 11 | 12 |
| ReykjavíkThe flattest row in the table, 1.31 to 2.26, because Icelandic cloud varies less than Arctic cloud. It matters if you have one night and cannot chase the weather. | 1 | 2 | 3 | 4 | 5 | 6 | 7 | 8 | 9 | 10 | 11 | 12 |
| FairbanksDeep winter is the good part here, the reverse of the Scandinavian advice. January reaches 3.46 while September, the month the trade recommends by reflex, is the weakest at 1.62. | 1 | 2 | 3 | 4 | 5 | 6 | 7 | 8 | 9 | 10 | 11 | 12 |
| YellowknifeThe only row where September is not the weakest month, and one of two where the geomagnetic season cannot drag it to the bottom. November is the low point instead, at 2.05. | 1 | 2 | 3 | 4 | 5 | 6 | 7 | 8 | 9 | 10 | 11 | 12 |
Cloud from ERA5 via Open-Meteo, eleven seasons to April 2025. Darkness from ephemerides. Geomagnetic factor from the GFZ series, 1932 to 2026. April to August is outside our record, not aurora free.
March is the equinox that actually works
Both equinoxes collect the same geomagnetic bonus. Only one of them hands it to you at an hour when you can see anything.
March is the most active month of the year, 19.4% above the annual mean, and in Finnish Lapland it is also the clearest month of the season: Rovaniemi opens on 50.0% of nights, Levi on 50.3%, Kiruna on 54.8%. The same two Finnish towns manage 20.0% and 22.7% in November. Darkness is back to 4.3 hours a night at Rovaniemi, 61% of its March nights come without meaningful moonlight, and it is low season for aurora travel.
On the index March is the best month of the season at Rovaniemi (2.55), Kiruna (2.84), Levi (2.29), Saariselkä (2.16) and Anchorage (2.49). The new moon of 8 March 2027 falls inside that window. It is the closest thing to an alignment of every variable this hemisphere offers, and it arrives after the aurora trade's own peak has passed, which should tell you how much of aurora pricing is about the Christmas calendar rather than the sky.
March is not a universal answer. It falls apart where the cloud will not cooperate: 1.19 at Tromsø and 1.33 at Alta, both of which do much better in October. The rule is not go in March. It is go in March if you are going to Finnish or Swedish Lapland, and go in October if you are going to the Norwegian coast. How the moon and the darkness interact across the season is worked through on the moon and darkness page of the guide.
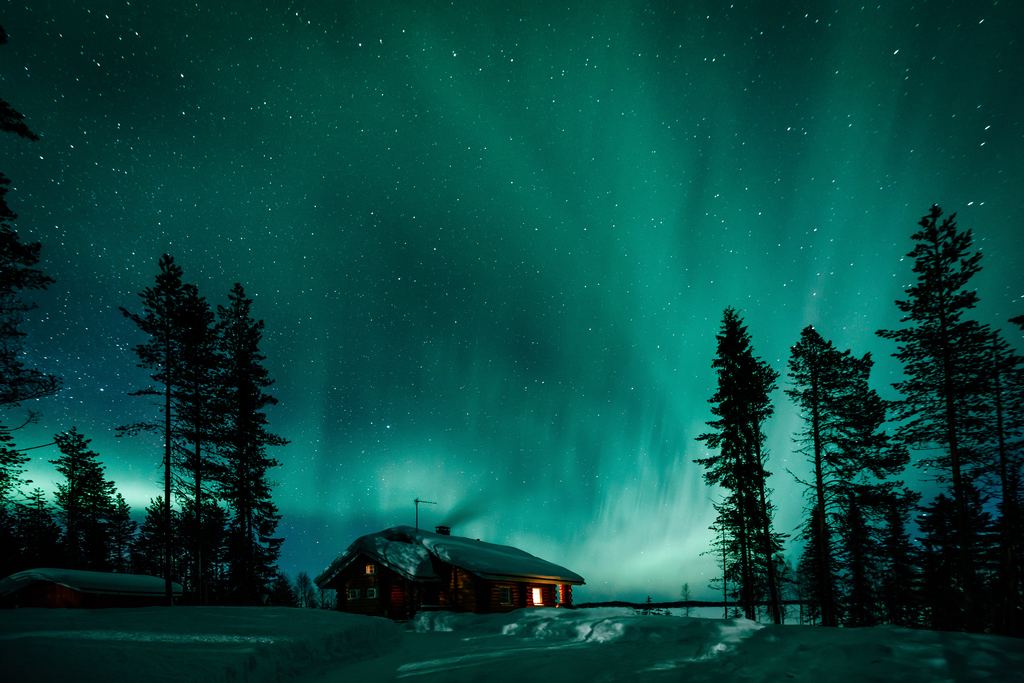
The March window in Finnish Lapland
Rovaniemi reaches 50.0% of nights with usable sky in March, the best month of its own year, against 20.0% in November. Add 4.3 hours of darkness and the strongest geomagnetic month of the year and the index reaches 2.55, its own season high.
The catalogue follows the market rather than the sky, and here for once the two agree: this is the deepest set of tours we carry anywhere, and it sits in the month our own numbers would have picked.
What the equinox does not tell you about tonight
Everything above is a climatology. It describes ninety-four Septembers rather than this one, and it makes no claim whatsoever about the next eight hours. The equinox itself fell at 00:09 UTC this morning on our own ephemeris, and the published almanacs put it a few minutes earlier. Nothing in this article moves by a few minutes.
Three things it cannot do for you tonight.
It cannot see your sky. The bonus applies to magnetic activity, and magnetic activity does not clear cloud. September gives Tromsø its most open sky of the season at 34.0% of nights, and that is still two nights in three with the lid on. Cloud is the variable that decides your trip, and we keep the whole method for measuring it on the page about when the sky actually opens.
It cannot tell you where the aurora is. Kp is a planetary average assembled from thirteen observatories sitting between 44 and 60 degrees of geomagnetic latitude, and not one of them is in the Arctic. It is also an average over three hours, while a substorm runs for ten to thirty minutes, so a mediocre Kp does not rule out a very good half hour. What the index can and cannot support is set out on the guide page about the Kp index.
It does not know about the moon. The equinox belongs to the solar calendar and the moon keeps its own, and this year the two are badly out of step. The September equinox falls between the new moon of 11 September and the full moon of 26 September, much nearer the full one. The dark nights of this particular equinox window were a fortnight ago. The next clean run is the new moon of 10 October, which lands inside the best month of the season for the Norwegian coast.
What these numbers are not
- Not a forecast. A climatology says what ninety-four Septembers did on average. It says nothing about tonight, and nobody should book a flight on the strength of a monthly mean.
- Not a probability. The index multiplies three averages as though they were independent. Magnetic activity genuinely does not care about your cloud, but cloud and darkness both have a season of their own, so the product is a declared approximation rather than a joint model.
- The thresholds are ours. Cloud at or below 50% for at least two hours, an 18:00 to 02:00 window, the sun below minus eighteen degrees. Reasonable choices, not laws, and different ones give different numbers. We publish them so that a disagreement can be about something specific.
- ERA5 is a reanalysis on a grid of roughly 28 km. Excellent for climate, useless as a forecast, and blind to anything at valley scale. Abisko is where that limit bites hardest, and it is why our bottom row there is not a refutation of anyone's blue hole.
- The moon and the cold are outside the index. Both are tracked separately. A full moon high in the sky spoils a faint display that this calculation counts as a success, and minus thirty-five degrees decides how long you actually stay out.
- Activity is not aurora seen. Every figure here is a ceiling. You still need the sky open above your own head, and you still need to be looking up while it happens.

The equinox and the aurora: what people actually ask
Are the northern lights really better around the equinox?
Yes, and it is one of the few claims in this trade that holds up when you check it. On the GFZ Potsdam record from 1932 to 2026, March is 19.4% above the annual mean for magnetic disturbance and September is 17.5% above it, while December sits 20.4% below. The effect has a name, the Russell-McPherron effect, and a 1973 paper behind it.
How much better, in numbers?
It depends on what you count, and that is not a dodge. Taking March and September against June and December, the equinox months run 1.41 times the solstice months on mean ap, 1.71 times on the frequency of three hour intervals reaching Kp 4 or above, and 1.45 times on the count of days with at least one such interval. Restrict the record to 1996 onwards and those become 1.34, 1.79 and 1.55. Any single figure quoted without its metric and its window is not checkable.
Why do so many sites say activity doubles at the equinoxes?
Because the threshold version of the ratio is close to double and is the most flattering of the three. We are not calling the claim false, we found a metric that supports it. What is missing everywhere we looked is the sentence saying which metric, over which years, which is the difference between a fact and a slogan.
Is September a good month to see the northern lights?
It is the month the trade recommends by reflex and the weakest month of the season in twelve of the fourteen places we measure, even after the equinox bonus is added in. The problem is darkness, not cloud: Tromsø gets 1.8 hours of true darkness a night in September against eight in December. September has the open skies and no night to put them in.
Is March better than September?
Considerably, and for a reason that has nothing to do with the equinox itself. March is marginally the more active of the two months, 19.4% against 17.5%, but it also brings 4.3 hours of darkness instead of under two, and in Finnish Lapland it brings the clearest sky of the year. Rovaniemi scores 2.55 on our index in March against 1.37 in September.
Does the equinox effect apply to a single night?
No, and this is where the idea gets oversold. It is a seasonal tilt visible only across decades of data. The equinox does not make tonight a good night, it makes the weeks around it slightly more likely to contain good nights. For any given evening the cloud above you matters far more, and a three hour Kp average from thirteen mid latitude observatories tells you surprisingly little about what is happening over the Arctic.
When are the good dark nights around this equinox?
They have mostly been and gone. The new moon fell on 11 September 2026 and the full moon falls on 26 September, so the equinox itself lands three nights before a full moon. The next clear run of dark nights is around the new moon of 10 October, which happens to fall inside the best month of the season for Tromsø, Alta and Abisko.
Aurora tours in Rovaniemi
The destination this article keeps arriving at: the strongest March on our index, in the month that is also the most active of the year, at low season prices.
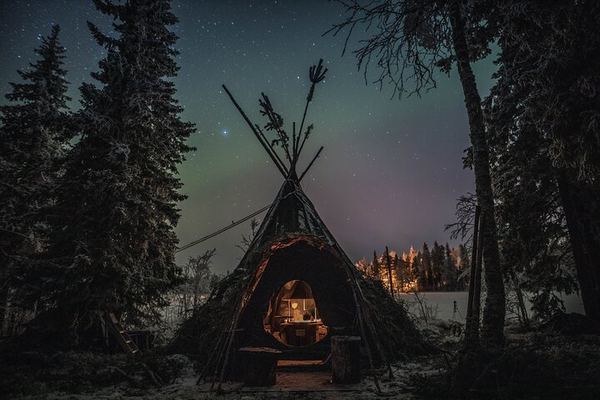
Arctic Lake Aurora Hunt from Rovaniemi with a Lappish Tipi
A quiet evening out on the Arctic lake, away from the city lights, with a Lappish tipi to warm up in between checks on the sky. Small and unhurried.
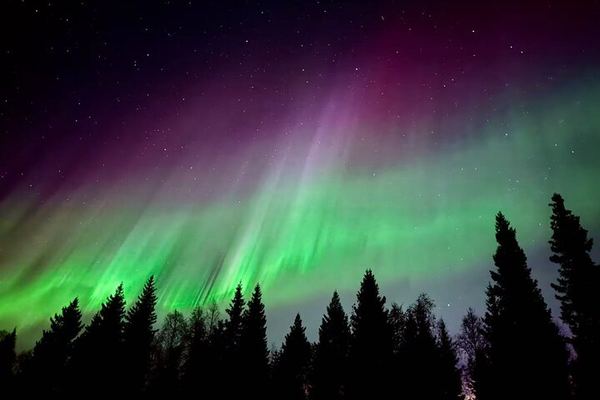
Aurora BBQ at a Private Kota near Rovaniemi, Three Hours
Fifteen minutes from the centre to a private site in Arctic forest, then the evening stays put: a kota with a fire in the middle, barbecue and marshmallows.
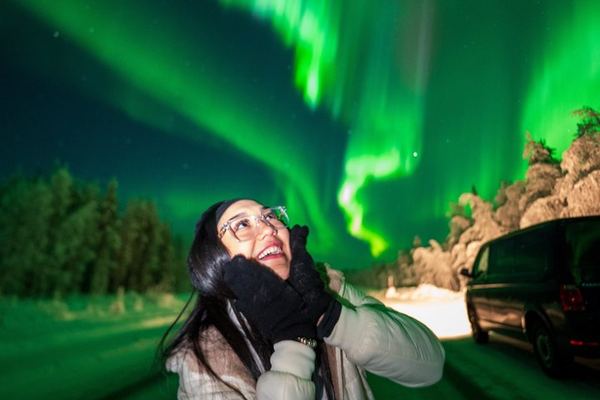
Aurora Chase from Rovaniemi with a Deep Sky Telescope on Board
A smart telescope rides in the van and locks onto Saturn, Andromeda or the Orion Nebula while the aurora watch continues. Eight guests, hosted by the owner.
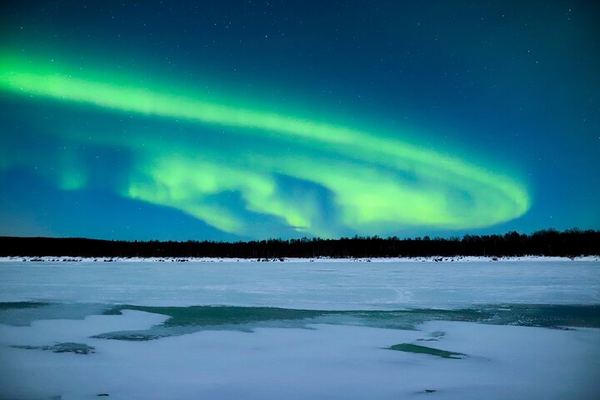
Aurora Evening on a Frozen Lakeside near Rovaniemi
A frozen lake gives what no forest clearing can, an unbroken horizon with the northern sky visible to the treeline. Campfire and a hot drink for the wait.
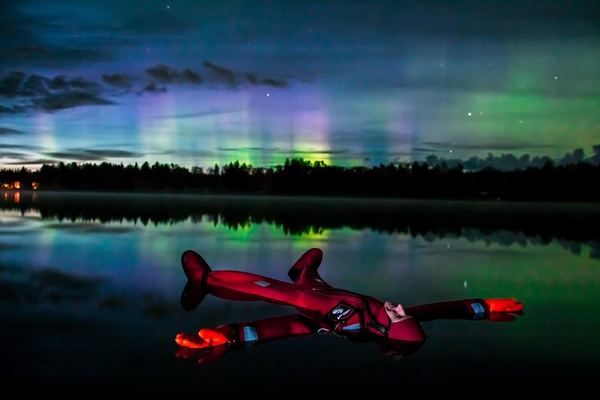
Aurora Floating in Rovaniemi: Watch the Sky from Open Water
You watch this one on your back in open water, in a rescue suit that keeps you warm and afloat. No swimming ability needed, and no craning your neck.

Aurora Gastronomy: Gourmet Glass Igloo Dinner and Snowmobile Safari
Regional cooking over an open fire, served in a private glass igloo on a frozen lake, then a snowmobile safari through the forest. Stars either way.
Ratings collected by Viator and Tripadvisor
Sources
This article carries no outbound links, deliberately. Every figure in it is either computed by us from a named open dataset or drawn from our own documented survey of the market, and we were not able to open an external page at the time of writing to confirm a link still resolved. On a site whose entire argument is that numbers should be checkable, a link we have not opened ourselves is worse than no link, so the sources are named precisely enough to find and re-run.
- Geomagnetic activity: the Kp and ap series maintained by GFZ Potsdam, eight Kp readings a day plus a daily ap, from 1932 to 2026. Open data, no key required. Ninety-four complete calendar years were used, and the ratios compare the two equinox months, March and September, against the two solstice months, June and December.
- The mechanism: C. T. Russell and R. L. McPherron, Semiannual variation of geomagnetic activity, Journal of Geophysical Research, volume 78, issue 1, page 92, 1973.
- Cloud cover: ERA5 reanalysis, produced by ECMWF for the Copernicus Climate Change Service and queried through the Open-Meteo historical archive. Eleven seasons, 1 September 2015 to 30 April 2025. A night counts as usable at 50% cloud cover or less for at least two continuous hours between 18:00 and 02:00 local standard time, with the hours after midnight attributed to the preceding day.
- Darkness and moon: standard ephemeris algorithms, Meeus, Astronomical Algorithms, second edition. Sun below minus eighteen degrees inside the same window; lunar interference from illuminated fraction together with altitude above the horizon, since a full moon that has set does not spoil anything.
- Equinox timing: computed with the same ephemeris code, which puts the September 2026 equinox at 00:09 UTC on 23 September. Published almanacs give a time a few minutes earlier, and nothing here depends on the difference.
- Claims made by the trade: our own survey of operator and tourism board material, recorded in August 2026. Operators are not named where our own record does not name them.
Data verified on. Kp and ap from GFZ Potsdam, 1932 to 2026. Cloud from ERA5 via Open-Meteo, eleven seasons to April 2025. Darkness and moon from standard ephemerides. Thresholds are ours. About This Site
Activity is the easy half of the problem
How often the sky actually opens in each destination, the thresholds behind every figure on this page, and the four things the measurement cannot see.