The Kp Index You Are Checking Comes From Virginia, Germany and Canberra
The number every aurora app shows you is assembled from magnetometers in Virginia, Germany and Australia. Not one of the thirteen observatories behind Kp is inside the Arctic Circle, and the live value uses only eight of them. What that does and does not tell you.
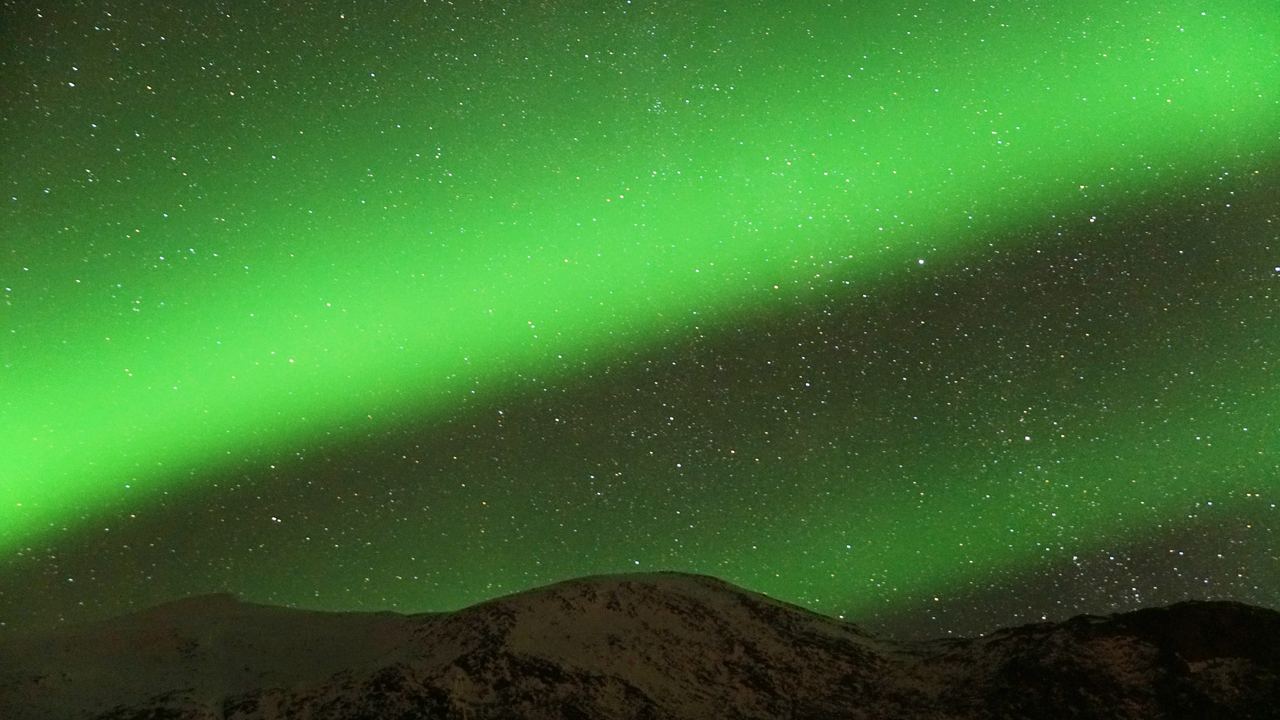
The Kp index on your phone says 2, and the sky over your head is doing something that does not look like a 2. This happens all the time in Tromsø, and the explanation is not that the index is broken. It is that the number was measured a very long way from where you are standing.
Thirteen magnetic observatories feed Kp. The northernmost of them is on Shetland. The live version, the one nearly every aurora app displays, is built from only eight of the thirteen, and one of those eight is at Fredericksburg in Virginia, at 38.2 degrees north. That is the latitude of Athens. Not a single station in either set is inside the Arctic Circle, and none of them sits under the auroral oval.
That is not an oversight. It is the design. Kp was built to describe the whole planet, and putting an instrument under the aurora would have wrecked it. The consequence for a traveller is that the most quoted number in this trade is, by construction, measured everywhere except where you booked.
What the Kp index actually measures
Start with the local K index, which Julius Bartels introduced at the Niemegk observatory near Potsdam in 1938. At a single observatory you take the horizontal component of the magnetic field, subtract what a quiet day looks like at that particular site, and measure how far the trace wanders over three hours. That range becomes a whole number from 0 to 9 on a quasi-logarithmic scale, and the scale is calibrated per station: the same wobble earns a different K at Sitka than at Canberra.
Bartels then did the thing that makes Kp useful and also makes it useless for your evening. In 1949 he published conversion tables, worked out statistically, whose purpose was to strip out the effect of each observatory's own geography before the local values were averaged together. Standardise, then combine, and you get one planetary figure, quoted in thirds: 0, 0+, 1-, 1, 1+, and so on up to 9.
Read that sentence again with a traveller's eyes. The standardisation exists to remove location from the answer. Kp is not a weak local measurement that happens to be taken far away. It is a measurement from which locality has been deliberately subtracted. What the index can and cannot support in general is set out on our guide page about the Kp index; this article is about where the instruments physically are.
The standardisation exists to remove location from the answer. Kp is not a weak local measurement taken far away. It is a measurement from which locality has been deliberately subtracted.
The eight magnetometers behind the number in your app
There are two different numbers in circulation, and both are called Kp.
The official index is derived at GFZ Potsdam, at the Adolf Schmidt Geomagnetic Observatory in Niemegk, which took the job over in January 1997. It uses all thirteen observatories, and it cannot exist until the three hour window has closed and the contributing stations have reported.
The number on your screen tonight is almost certainly not that one. It is NOAA's estimated planetary K index, updated every minute, and NOAA derives it from eight ground based magnetometers that report in real time. NOAA says so on its own product page, and adds that because the contributing network is not identical to the official one, the real time estimate and the official value can differ.
Eight stations. These are them, with their geographic latitudes.
| Observatory | Where | Geographic latitude |
|---|---|---|
| Sitka | Alaska, United States | 57.1 N |
| Meanook | Alberta, Canada | 54.6 N |
| Wingst | Germany | 53.7 N |
| Niemegk | Germany | 52.1 N |
| Hartland | England, United Kingdom | 51.0 N |
| Ottawa | Ontario, Canada | 45.4 N |
| Fredericksburg | Virginia, United States | 38.2 N |
| Canberra | Australia | about 35 S |
The northernmost is Sitka, in the Alaskan panhandle, at 57.1 degrees north. Tromsø is at 69.6. That is a gap of 12.6 degrees of latitude, roughly 1,400 kilometres. Fredericksburg is 31 degrees south of Tromsø, which is a longer distance than London to Marrakesh.
So when an app tells you Kp is 2 while you are standing on Kvaløya, the closest thing to a witness in that calculation is a magnetometer in a field in southeast Alaska.

Not one of the thirteen is inside the Arctic Circle
The full official set adds five more to the eight above: Lerwick and Eskdalemuir in the United Kingdom, Brorfelde in Denmark, Lovö in Sweden, and Eyrewell in New Zealand.
Lerwick, on Shetland, is the northernmost of all thirteen at 60.1 degrees north. The Arctic Circle is at 66.6. Lerwick is therefore about 710 km south of the line most people treat as the start of aurora country, and about 1,050 km south of Tromsø. Lovö, near Stockholm, comes second at 59.3.
There is no Arctic station in Kp, and there never has been.
| Observatory | Country | In the live eight |
|---|---|---|
| Lerwick | United Kingdom | no |
| Eskdalemuir | United Kingdom | no |
| Hartland | United Kingdom | yes |
| Lovö | Sweden | no |
| Brorfelde | Denmark | no |
| Wingst | Germany | yes |
| Niemegk | Germany | yes |
| Sitka | United States | yes |
| Fredericksburg | United States | yes |
| Meanook | Canada | yes |
| Ottawa | Canada | yes |
| Canberra | Australia | yes |
| Eyrewell | New Zealand | no |
The two latitude bands, and which one we are following
Here the institutional documentation contradicts itself, and since this site exists to publish numbers with their provenance attached, we are not going to quietly pick one.
NOAA's planetary K index page describes Kp as the mean standardised K index from thirteen observatories between 44 and 60 degrees northern or southern geomagnetic latitude. The GFZ site list for the same thirteen observatories describes them as lying between 46 and 63 degrees geomagnetic. Same stations, same index, two bands, both published by institutions with a direct hand in producing it.
We have used the 44 to 60 figure in our own geomagnetic notes, because it is the one printed on the NOAA product page most people land on. We are flagging the discrepancy rather than resolving it: we could not open either page from where this was written, and a third source fetched second hand would be a guess dressed up as a check.
The disagreement does not change the conclusion, which is the useful thing about it. Geomagnetic latitude is not geographic latitude, and the auroral oval on a quiet night sits somewhere around 65 to 70 degrees geomagnetic. Whether the top of the Kp band is 60 or 63, the band stops below the oval either way. Subauroral is the word the literature uses, and it means what it says. Why the oval sits where it does is on the guide page about the auroral oval.
Three different numbers, all with the same name
| What it is | Who makes it | When it exists | What it is for |
|---|---|---|---|
| Estimated planetary Kp | NOAA SWPC, from 8 real time stations | Updated every minute | Alerts and live displays |
| Official Kp | GFZ Potsdam, from all 13 | Once the three hour window closes and stations report | The scientific record, back to 1932 |
| Forecast Kp | NOAA SWPC and others | Ahead of time, as a prediction | Planning, with a forecast's error bars |
App disagreement is not a bug in one of the apps. Some show the estimate, some show a forecast, some show the settled value once it arrives. Three quantities, one name, and hardly anybody labels which one is on screen.
How the number got to your phone
Six dates that explain why the index is shaped the way it is, and why the shape has barely changed in seventy-five years.
The origins
1932
The record begins
The Kp and ap series now kept by GFZ Potsdam starts: eight readings a day plus a daily index of how disturbed Earth's magnetic field was. It is the long baseline every claim about solar cycles is measured against, and it is open data.
1938
Bartels defines the local K index
At the Niemegk observatory near Potsdam. One station, one three hour window, the range of the horizontal field against that site's own quiet day curve, mapped onto 0 to 9. The scale is calibrated per observatory from the start.
1949
Kp becomes planetary
Bartels publishes the standardisation tables that remove each observatory's geography before averaging. This is the step that makes the index comparable across decades and, for the same reason, blind to where you are standing.
The growth
January 1997
Derivation moves to GFZ Potsdam
The work passes to the Adolf Schmidt Geomagnetic Observatory at Niemegk, where the official index has been produced ever since. The method does not change, which is the point of it.
2021
The reference description is published
Matzka and colleagues set out what the index is and how it is derived, in Space Weather. It is the paper to reach for when a site tells you what Kp means and does not say where it got that.
Today
2022
Hpo arrives, at half hourly cadence
Yamazaki and colleagues publish the Hpo family in Geophysical Research Letters: Kp-like, but at 30 and 60 minute resolution and with no ceiling at 9. Computed back to 1995. It fixes the averaging window and leaves the latitudes alone.
The three hour problem, and the index that fixes half of it
Kp averages over three hours. An auroral substorm, the sudden brightening that produces the displays people remember, typically runs for ten to thirty minutes. A brilliant twenty minutes followed by a hundred and sixty quiet ones comes out of the arithmetic looking mediocre, and by the time the window has closed and the value exists, the show is over.
GFZ published a fix in 2022. The Hpo family works like Kp but at half hourly and hourly resolution, and it is open ended: where Kp stops at 9, Hp30 keeps counting, so the largest storms are no longer compressed against a ceiling. The series has been computed back to 1995 and is published in near real time.
It is a real improvement, and it solves exactly one of the two problems in this article. Hp30 is derived from subauroral observatories too. Higher cadence, same latitudes. If your objection to Kp is that nobody is measuring anywhere near you, Hp30 does not answer it.
The stations that do sit under the aurora, and are not in Kp
Norway has magnetometers exactly where you would want them. Tromsø Geophysical Observatory, at the university in Tromsø, publishes provisional local K indices for a chain that includes Tromsø itself, Andenes, Bjørnøya, Ny-Ålesund and Dombås, computed automatically and available for the last several days. A 2025 review in Annales Geophysicae covers the digitised Norwegian K series, continuous at Tromsø since 1947.
Those are readings from inside the auroral zone. They are also, for precisely that reason, the readings Kp cannot use: a station under the oval saturates during ordinary activity, and it would break the comparability that makes a planetary index worth having in the first place.
Which is the whole trade-off in one sentence. The index that is consistent across ninety-four years is consistent because it looks away from the aurora, and the instruments that watch the aurora are the ones no planetary index will accept.
A reading from your own latitude
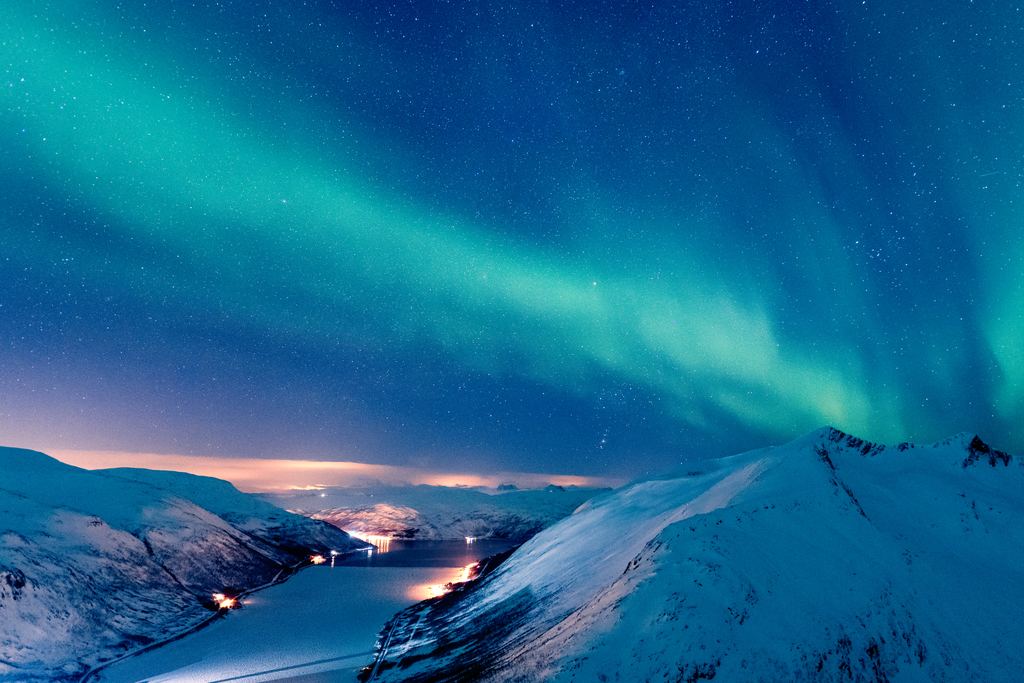
Tromsø sits at 69.6 degrees north, inside the auroral oval. The nearest instrument feeding the live Kp value is 1,400 km away in Alaska, and the nearest feeding the official index is 1,050 km away on Shetland.
The local K indices published by Tromsø Geophysical Observatory come from the same latitude you are standing at. They are provisional, they cover only the last few days, and no app will push them to you. They are also the only magnetic reading in this article taken under the sky you are actually looking at.
What Kp is unmatched at
None of this makes Kp a bad number. It makes it a badly used one.
Because it has been produced the same way since 1949, on a record running back to 1932, Kp supports comparisons that nothing else can. Our own work leans on it heavily. Here is what that looks like when the metric is stated alongside the figure:
On the GFZ Kp and ap series, 1932 to 2026, ninety-four complete years, December sits 20.4% below the annual mean for magnetic disturbance, measured on mean monthly ap. It is the weakest month of the year, and it is high season. March is the strongest at 19.4% above the mean.
Comparing the equinox months against the solstice months on the same record gives 1.41 times on mean ap and 1.71 times on the frequency of three hour intervals reaching Kp 4 or above. Two right answers to the same question, which we worked through in detail when the September equinox came round.
Days with at least one interval at Kp 3 or above average 226 a year, with a range across those ninety-four years of 53 to 322. The often repeated figure of about 200 aurora nights a year has a real basis. The six-fold spread between a solar minimum and a solar maximum is the part that never gets printed next to it.
Every one of those statements is about decades. Not one is about tonight, and no amount of extra resolution in the index would make it about tonight, because the missing ingredient is cloud and Kp has never contained any information about cloud at all.
What to do with the number instead
Four consequences of where the stations are
None of these are thresholds, and none of them override cloud.
A low Kp does not mean stay in
From inside the oval, ordinary activity is overhead activity, and the subauroral stations that produce Kp record ordinary activity as a small number. A clear sky and Kp 2 in Tromsø is a night worth going out on.
A high Kp is not automatically better where you are
A large storm pushes the oval south. From Tromsø that can mean the brightest part of the display has moved to somewhere south of where you are standing.
For tonight, live signals beat the index
Bz, the north-south orientation of the interplanetary magnetic field measured upstream at the L1 point, gives 15 to 60 minutes of warning and is a measurement rather than a three hour average. The oval maps show where the ring is now.
For a local reading, find a local instrument
In northern Norway the Tromsø Geophysical Observatory K indices come from your own latitude. No planetary index does, and none of them is trying to.
Above all of it sits the cloud, which decides more aurora trips than every geomagnetic index put together, and which is the one variable in this whole business you can plan for months ahead. How often the sky actually opens, destination by destination and month by month, is the measurement we keep on when the sky actually opens.
What people actually ask about Kp
Where does the Kp index come from?
From thirteen geomagnetic observatories in both hemispheres: Lerwick, Eskdalemuir and Hartland in the UK, Ottawa and Meanook in Canada, Fredericksburg and Sitka in the US, Brorfelde in Denmark, Lovö in Sweden, Wingst and Niemegk in Germany, Canberra in Australia and Eyrewell in New Zealand. The official index is derived at GFZ Potsdam. None of the thirteen is in the Arctic.
Is there a Kp station in Tromsø or Lapland?
No. The northernmost contributor is Lerwick on Shetland at 60.1 degrees north, about 1,050 km south of Tromsø. Arctic magnetometers do exist and publish local K indices, but a station under the auroral oval cannot feed a planetary index without breaking the comparability the index exists for.
Why do two aurora apps show different Kp values at the same moment?
Because they are showing different quantities. NOAA's estimated planetary Kp updates every minute from eight real time stations; the official GFZ value uses thirteen and only exists once the three hour window has closed; forecast Kp is a prediction. NOAA states that the real time estimate can differ from the official value, because the two networks are not identical.
What Kp do I need to see the northern lights in Tromsø?
Lower than the apps imply. Tromsø sits inside the auroral oval, so activity that registers as a modest Kp at subauroral latitudes can be directly overhead. The cloud decides the night, not the index.
Is Hp30 better than Kp for aurora hunting?
For timing, yes: half hourly instead of three hourly, and with no ceiling at 9, so a substorm is not averaged away into the hours around it. For location, no. Hp30 is derived from the same subauroral observatories, so it inherits the same blind spot.
Does a high Kp guarantee a good night?
No. It says the planet's magnetic field was disturbed over the last three hours. It says nothing about the sky above you, and a clear night at Kp 2 beats an overcast one at Kp 6 every time.
Aurora tours in Tromsø
The city this article keeps measuring distances from: 69.6 degrees north, inside the oval, and 1,400 km from the nearest magnetometer feeding the number on your phone.
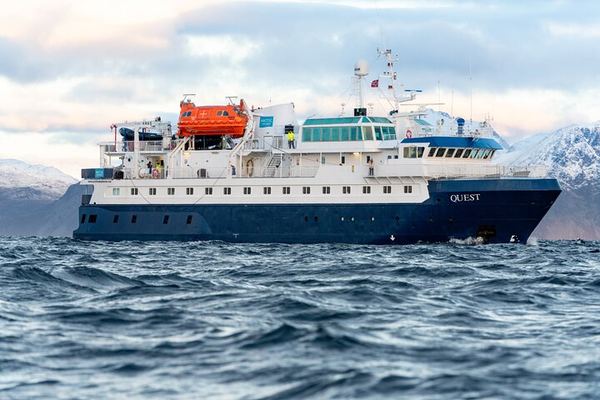
24 Hour Northern Lights and Whale Watching Cruise from Tromso
Sail across the auroral oval in the evening, sleep in a cabin while the ship moves, and wake on the whale grounds. Three-course dinner and lecture on board.
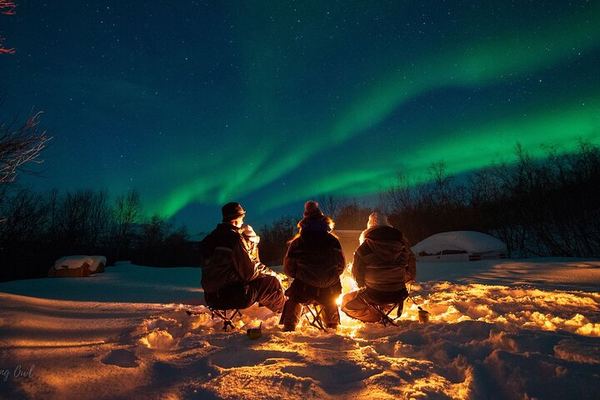
Adults Only Aurora Hunt from Tromso with Wandering Owl
An adults-only northern lights hunt from Tromsø: thermal suits, a campfire and a hot meal while the guides read the night's forecast. Photos included.
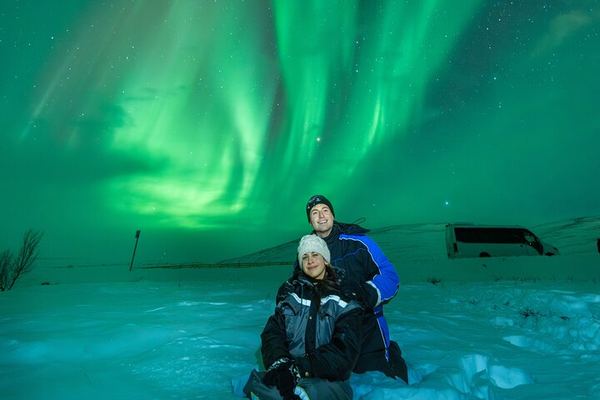
All Inclusive Aurora and Arctic Evening from Tromso with Campfire
Campfire, hot meal and photos on an all-inclusive aurora night from Tromsø. You get a forecast update the morning of, and can rebook if it turns.
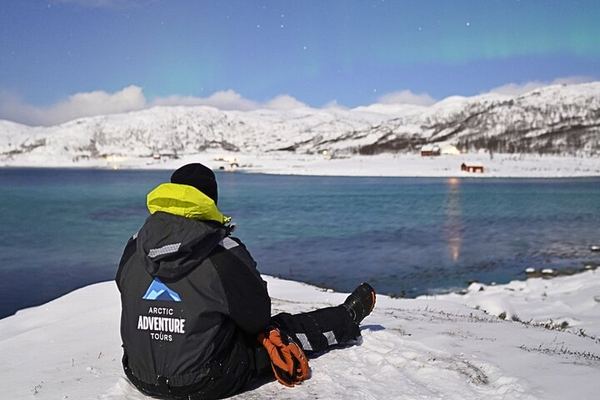
All Inclusive Northern Lights Hunt from Tromso, Max 15 Guests
Up to nine hours hunting clear sky from Tromsø in a group of 15, with a guide and driver working as a pair, an expedition meal and warm gear included.
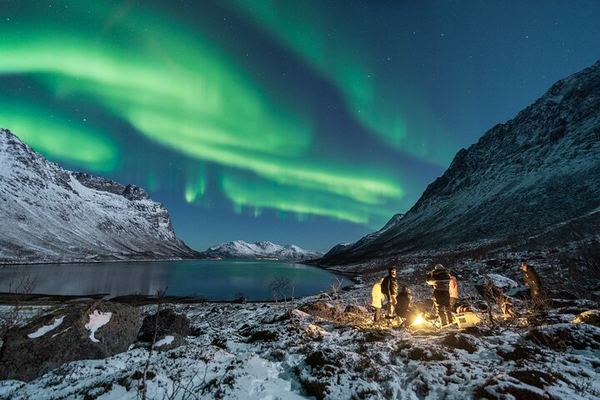
All Inclusive Northern Lights Hunt with The Green Adventure, Photos Included
Thermal suit and meal built into the price, a campfire with marshmallows, and expedition soup made in Tromsø that beats standing closer to the flames.
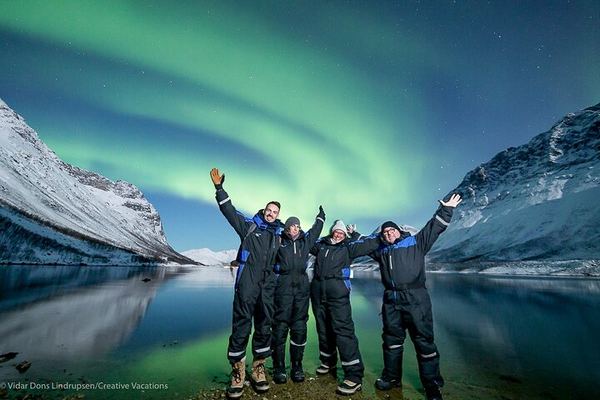
Aurora Adventure Tour from Tromso with Photographer Vidar
Seven hours under Arctic sky with Vidar, a professional photographer: real advice if you brought a camera, your portrait emailed to you if you did not.
Ratings collected by Viator and Tripadvisor
Sources
This article carries two outbound links and no others, which needs explaining. Both point to pages already cited on our own permanent guide page about the Kp index, where they were opened and checked. Everything else below is named precisely enough to find, but not linked, because we could not open it from where this was written, and a link we have not opened ourselves is worse than no link on a site that argues numbers should be checkable.
- The official index and its derivation: GFZ Potsdam, which has produced Kp at the Adolf Schmidt Geomagnetic Observatory in Niemegk since January 1997 (kp.gfz.de), including its published list of the thirteen contributing observatories and the 46 to 63 degree geomagnetic band.
- The real time estimate: NOAA Space Weather Prediction Center, planetary K-index, which names the eight contributing magnetometers, gives the 44 to 60 degree geomagnetic band, and states that the estimate can differ from the official value because the networks are not identical.
- The reference description: J. Matzka and colleagues, The Geomagnetic Kp Index and Derived Indices of Geomagnetic Activity, Space Weather, 2021, doi 10.1029/2020SW002641. The history of the local K index (Bartels, 1938) and of the planetary standardisation (Bartels, 1949) is set out there.
- The half hourly index: Y. Yamazaki and colleagues, Geomagnetic Activity Index Hpo, Geophysical Research Letters, 2022, doi 10.1029/2022GL098860. Hp30 and Hp60, Kp-like, open ended, computed back to 1995.
- Arctic local K indices: Tromsø Geophysical Observatory at UiT, which publishes provisional K indices for Tromsø, Andenes, Bjørnøya, Ny-Ålesund and Dombås. The digitised historical Norwegian series is reviewed in Annales Geophysicae, volume 43, 2025, page 241.
- Observatory coordinates: geographic latitudes as published by the operating institutions, the US Geological Survey, Natural Resources Canada, the British Geological Survey, GFZ and Geoscience Australia. Canberra is given as approximate because we could not confirm a decimal figure to the standard the rest of the column meets.
- Our own geomagnetic figures: the GFZ Kp and ap series, 1932 to 2026, ninety-four complete calendar years, recomputed by us. Metrics are stated next to every number above, because on this record the same question has more than one correct answer depending on what is counted.
One limitation worth stating plainly. The two latitude bands in the section above come from the two institutions' own published descriptions of the same thirteen stations, and we have not been able to reconcile them. We have reported both rather than choosing the more convenient one.
Data verified on. Station lists and definitions from GFZ Potsdam and NOAA SWPC; Matzka et al. 2021 and Yamazaki et al. 2022 for the derivation. Geomagnetic figures recomputed from the GFZ series, 1932 to 2026. About This Site
The number that actually decides your night
Not Kp, and not Hp30 either. Cloud cover, measured by destination and by month over eleven seasons, with every threshold published.